TeraWulf’s Bitcoin cost rises from $52,774 to $103,564 when miner depreciation is included
Source report: 2026-11-06 · Editorial analysis published: 2026-11-08
The November 6 filing separates direct operating costs, equipment depreciation and power costs net of curtailment payments.
Two cost figures tell different stories
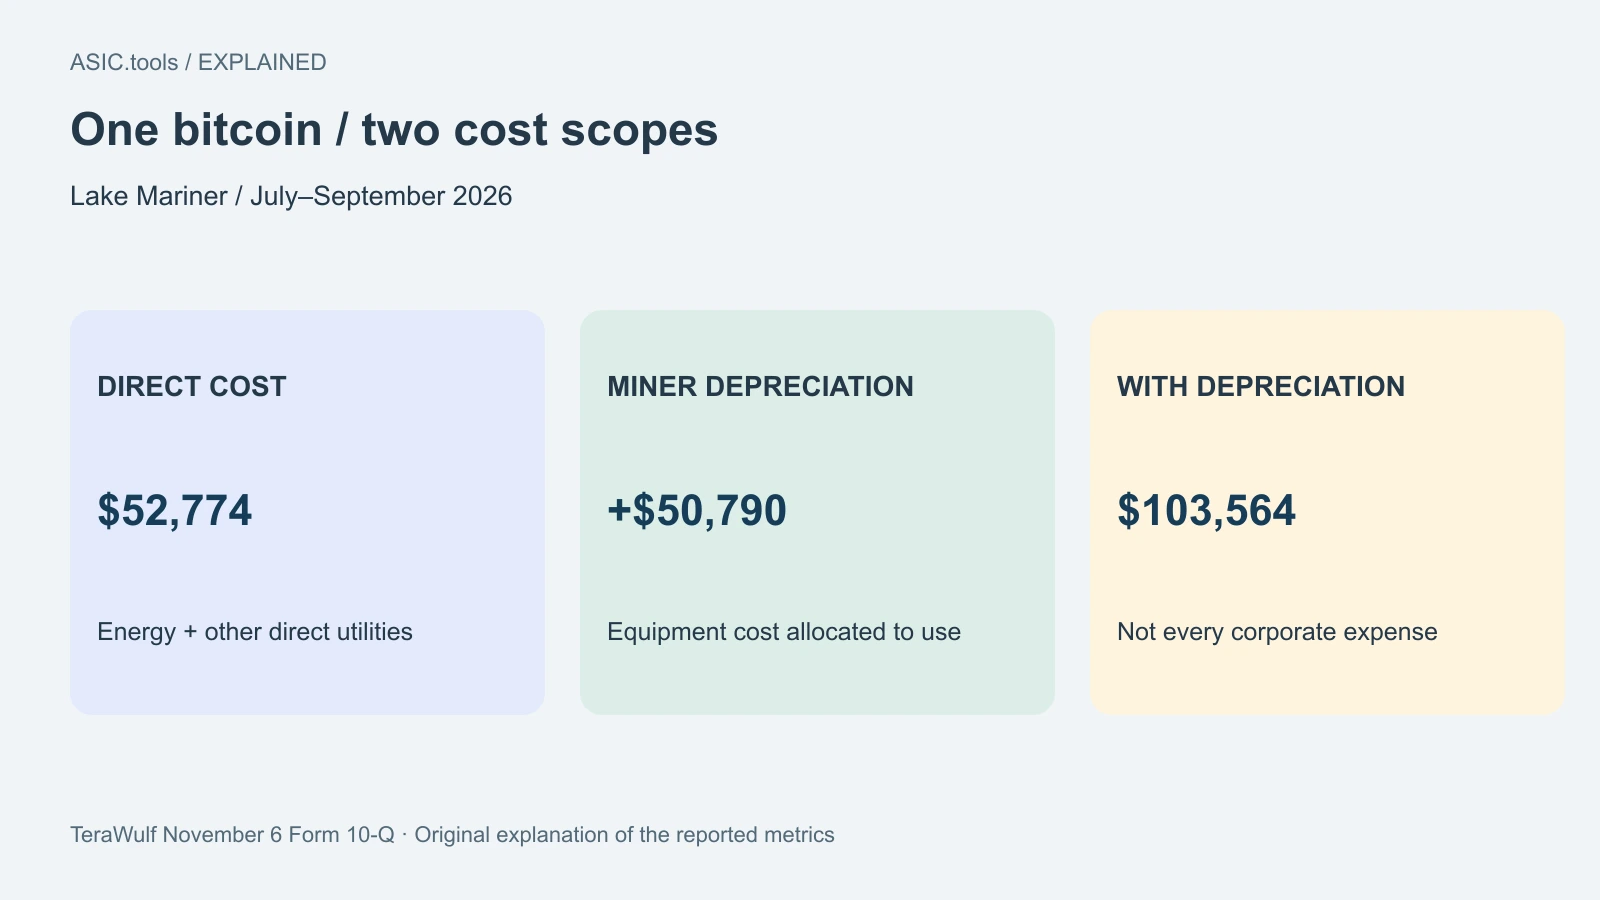
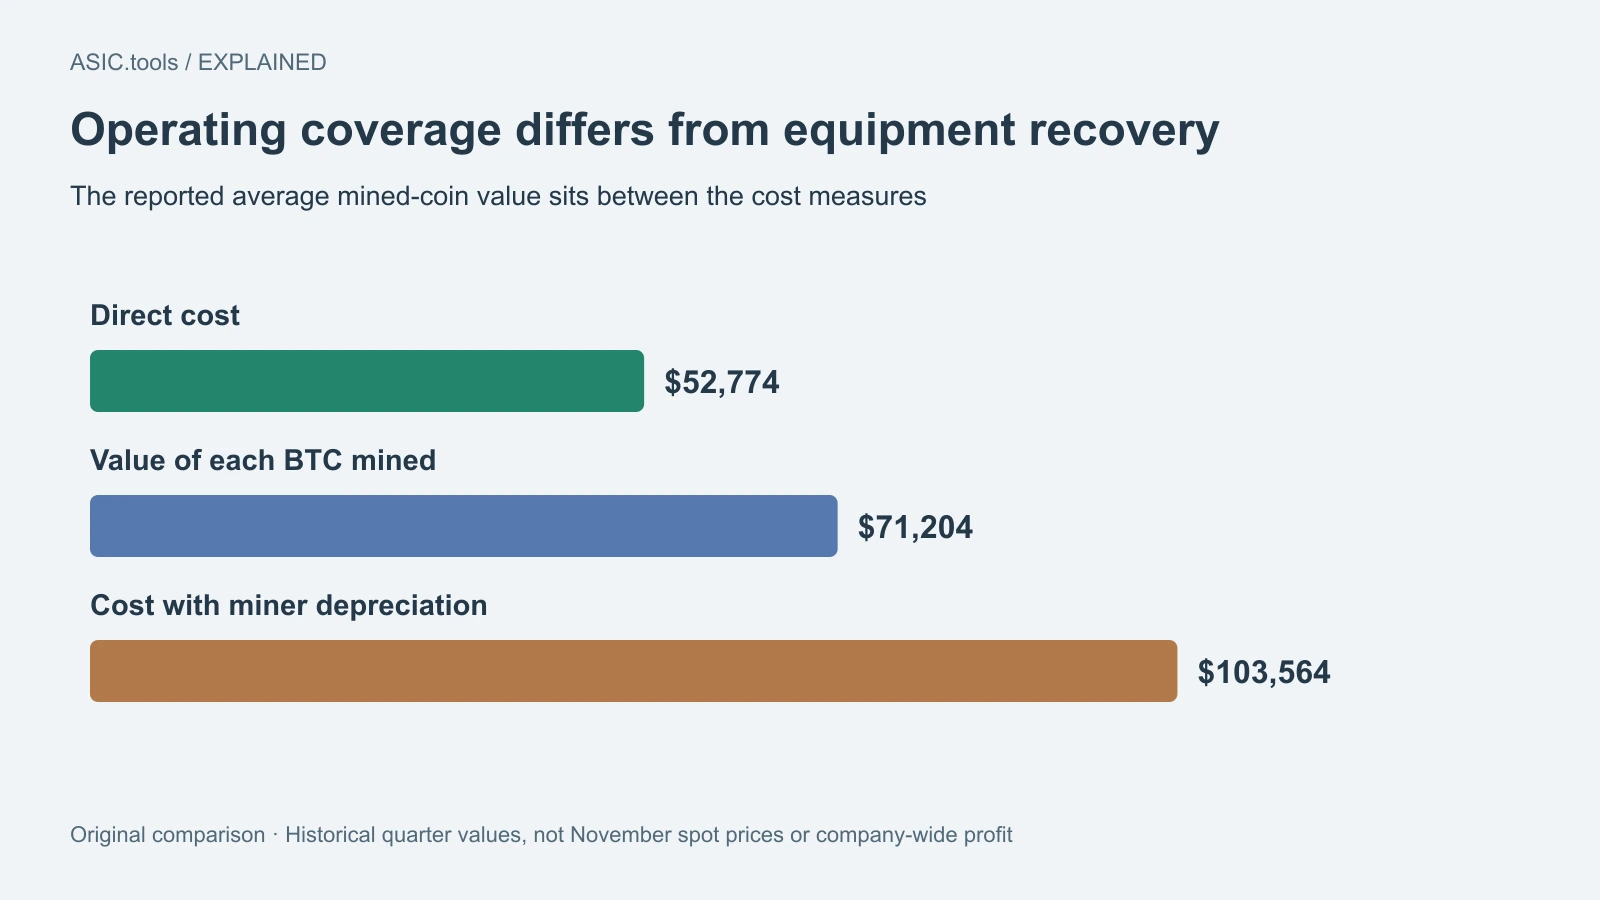
TeraWulf’s November 6 quarterly filing puts its Lake Mariner direct mining cost at $52,774 per bitcoin for July–September 2026. Adding depreciation of the miner fleet raises the figure to $103,564. The company’s average accounting value for the bitcoin earned was $71,204. Mining covered the reported direct costs, while that value was below the comparison including miner depreciation.
For an ASIC owner, this is a concrete example of two different questions: whether a machine covers today’s operating outlay, and whether its earnings also cover the equipment being used up. Depreciation spreads an asset’s cost over its useful life. It does not arrive as a new electricity invoice each month, but the equipment still represents capital committed to mining.
The figures concern the three months ended September 30 at Lake Mariner. The filing also gives nine-month figures, which are a different period. Its $71,204 value uses the weighted-average opening Bitcoin price on the days coins were earned. It is a historical accounting comparison, not a November spot price or a guaranteed sale price for every coin.
Electricity is most of the direct cost
The quarterly table assigns $52,634 per BTC to energy and $140 to other direct non-energy utility costs. Together they make the rounded $52,774 cash-cost metric. The company explicitly excludes depreciation from that metric when deciding whether operating its existing equipment is economical.
The site mined 186 BTC, compared with 377 in the same quarter of 2025. Its reported mined-coin value was $13.244 million, with net energy expense of $9.790 million and other direct mining costs of $26,000. Dividing the combined $9.816 million by 186 reproduces approximately $52,774 per coin.
That leaves about $18,430 between the reported value per coin and direct cost. Adding $50,790 of miner depreciation per coin instead puts the comparison about $32,360 above that value. These are arithmetic differences between the filing’s rounded measures. They are not company-wide profit or loss, which includes other business lines, expenses and accounting items.
Six cents includes the effect of curtailment payments
Lake Mariner used 162,558 MWh during the quarter. The table reports a realized power cost of about $0.060 per kWh, against $0.047 in the comparable 2025 quarter. MWh measures energy consumed; one MWh equals 1,000 kWh. Those figures describe a quarter’s electricity use and expense.
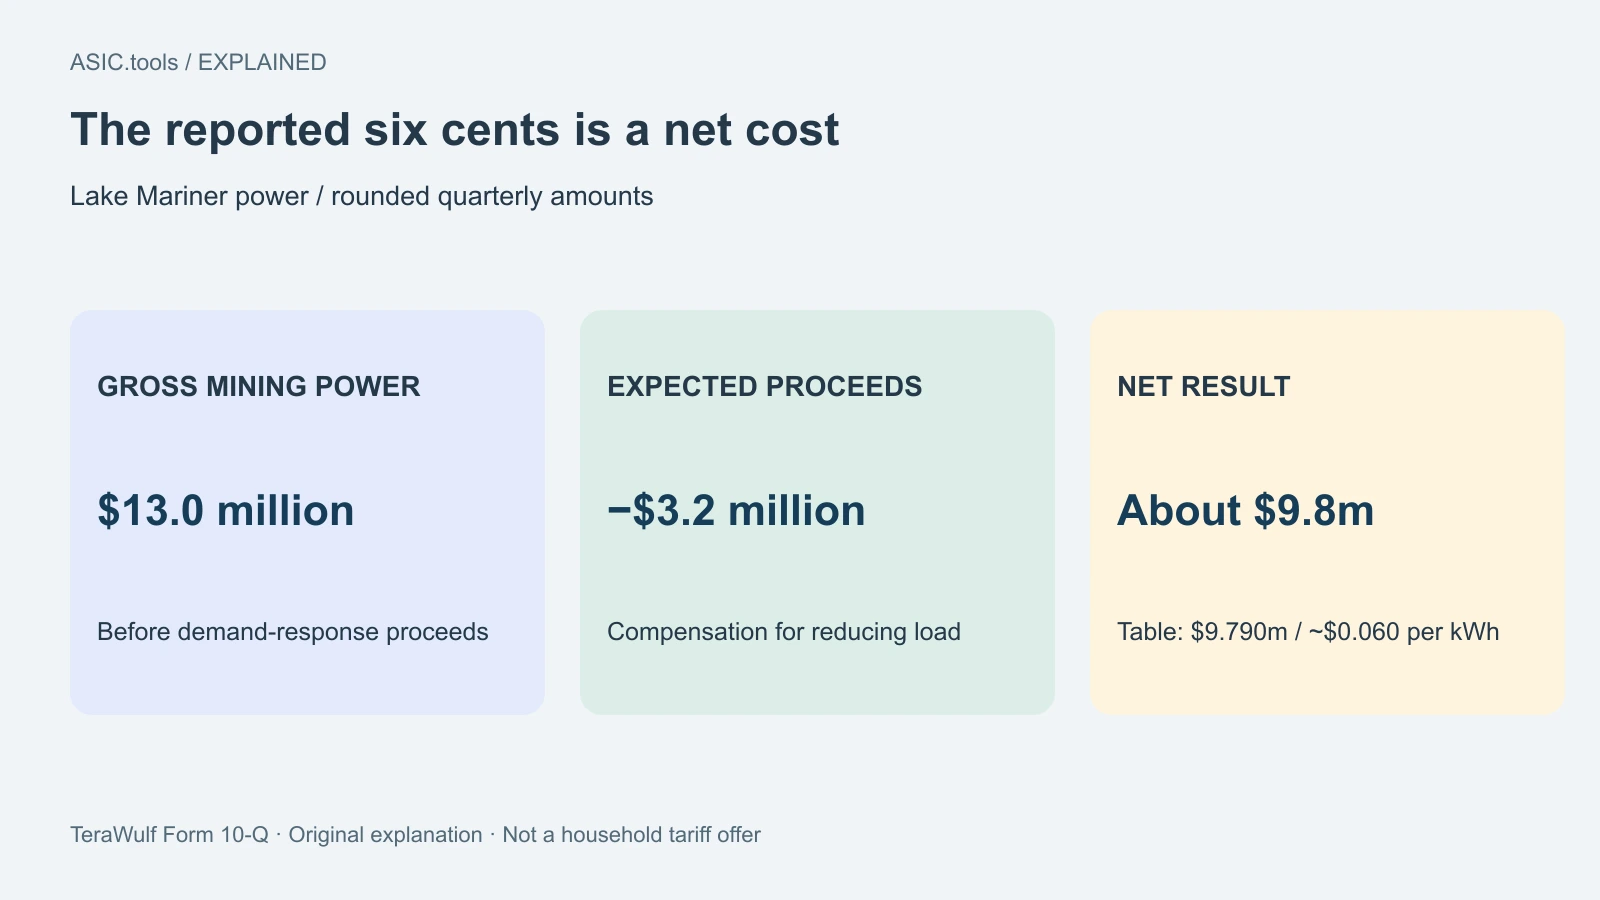
The six-cent figure is net of expected demand-response proceeds. Demand response means reducing consumption when the electricity system needs relief, under arrangements that can compensate the operator. TeraWulf reported about $13.0 million of gross mining power costs and $3.2 million of expected demand-response payments for the quarter.
The rounded subtraction is about $9.8 million, consistent with the more precise net-expense table. It would be misleading to present the net six-cent result as a universal utility tariff or a price any household could obtain. A home miner can apply the same accounting structure only with the actual bill and any compensation arrangement that really applies to that connection.
Running less changes more than the electricity bill
The company says it curtailed mining and repurposed or removed two mining buildings from service during the first nine months to support high-performance computing development. That helps explain why a smaller total electricity bill does not necessarily mean cheaper electricity or a lower cost per coin.
At September 30, Lake Mariner’s mining nameplate was 9.8 EH/s, while the company’s reported operational hashrate was 5.7 EH/s. EH/s is a measure of computing speed. Installed potential and operating output describe different things; the filing lists tuning, outages, weather, curtailment and maintenance among the factors affecting actual output.
The company says it manages mining hour by hour and can stop voluntarily when electricity prices exceed the value of the fixed Bitcoin reward, alongside required demand-response cuts. That is its operating policy in a variable-price market. A household on a fixed tariff has different inputs and cannot infer its own switching schedule from a company’s quarterly average.
Use both an operating view and an equipment view
For an existing home ASIC, record accepted mining income, actual running hours and metered energy together. Cooling and power-supply losses belong to the measured installation. The direct operating view helps explain whether running during a particular interval adds cash after the costs that apply during that interval.
For buying or replacing equipment, add the purchase price and a clear assumption about useful life or resale value. That broader view answers a different question from whether an already-owned machine covers its next electricity bill. TeraWulf’s separate depreciation comparison makes the distinction visible without requiring readers to treat a corporate accounting policy as their own forecast.
The November filing therefore provides an operating result and a capital-cost perspective with explicit boundaries. Its $103,564 comparison includes miner depreciation, but is still not every corporate cost. Keeping the period, expense scope and compensation treatment next to each figure makes the report useful to ordinary miners without turning one site’s results into a universal break-even price.
Lower production can also spread an equipment expense across fewer coins. This is why a per-coin figure needs its output denominator as well as its expense label. For someone considering a replacement ASIC, comparing machines over the same realistic operating period makes that capital-cost question clearer than comparing only their nameplate power.
Source: TeraWulf Form 10-Q ↗ · Issuer copy of the quarterly filing ↗ · November 6 quarterly results ↗
Mining calculator ↗