CoinShares puts listed miners’ Q2 cash cost at $75,500 per BTC
Source report: 2026-09-15 · Editorial analysis published: 2026-09-16
CoinShares’ September 15 report estimates a $75,500 weighted cash cost before tax per BTC for listed miners in Q2. What does that mean for an individual ASIC?
Analysis and practical implications
This section is our analysis and illustrative calculations, separate from the source report.
The new report and its reporting boundary
CoinShares published its Q2 2026 mining report on September 15. Its weighted estimate of listed miners’ cash production cost before tax is about $75,500 per BTC. This is a historical corporate comparison, not today’s electricity bill for every miner. The practical question is how an operator can compare that headline with measured equipment performance. The worked examples below are independent ASIC.tools scenarios, using invented round inputs rather than the operating results of any company in the report.
Why a weighted average differs from a typical miner
Consider two hypothetical producers: one mines 900 BTC at $60,000 cash cost per coin, the other 100 BTC at $100,000. Combining their $64 million of costs and 1,000 BTC of output gives $64,000 per BTC. Averaging the two quoted unit costs instead gives $80,000. Both calculations use the same inputs but answer different questions. A large producer has more influence in the output-weighted result. Readers should inspect the sample and denominator before treating a sector average as the experience of a small farm or a single ASIC owner.
Electricity, cash expenditure and equipment ownership
Power is only one part of operating a mining business. A device can cover electricity while failing to cover hosting, repairs, staff or financing. Depreciation describes the allocation of an equipment purchase over time; it is not an additional utility payment each day. Conversely, excluding depreciation from a cash metric does not make the initial purchase free. A useful comparison keeps power-only contribution, recurring cash expenditure and investment recovery in separate columns. It also states whether taxes are included, rather than mixing a before-tax headline with an after-tax result.
A calculation that can be reproduced
Assume an illustrative SHA-256 miner delivering 200 TH/s at 3.5 kW, a tariff of $0.06/kWh, a hypothetical hashprice of $40/PH/s/day and a 2% pool fee. At continuous operation it uses 84 kWh a day, costing $5.04. Its 0.2 PH/s produces a theoretical $8 of gross daily revenue, or $7.84 after the fee. Subtracting electricity leaves $2.80 a day before every other expense. These are assumptions, not current market quotations, a device recommendation or a profitability promise. Actual pool settlement and accepted work must be checked separately.
Downtime exposes the fixed-cost burden
Keep that same illustrative device and assume $100 of fixed monthly costs. Over 30 full operating days, its $84 electricity contribution leaves a $16 loss after the fixed charge. If productive operation falls to 90%, while revenue and mining power vary proportionally, the contribution becomes $75.60 and the loss becomes $24.40. This simplified model assumes no standby consumption or restart losses. The point is that a smaller electricity bill during downtime does not automatically improve the business: fixed charges remain while the denominator of productive hours shrinks.
Measure the whole electrical boundary
Suppose external infrastructure adds 5% to the example miner’s wall power. The total becomes 3.675 kW, using 88.2 kWh daily and costing $5.292 at the assumed tariff. Daily contribution then falls to $2.548, approximately $2.55, before other costs. This extra 5% is a scenario, not a measured cooling overhead. Do not add it twice if the contract or meter already includes those auxiliaries. A comparison should state where the meter sits, which fans and pumps it covers, and whether the hashrate is a nameplate rating or accepted pool work.
Efficiency upgrades need a separate investment test
Imagine a replacement that retains the same 200 TH/s but reduces draw from 3.5 to 2.5 kW. The one-kilowatt saving is 24 kWh per full day, or $1.44 at the example tariff and $43.20 per 30 days. An extra $1,000 purchase cost would take about 694 full operating days to recover from electricity savings alone. This is simple division, not a forecast: installation, resale value, downtime, repairs and future revenue can change the decision. Comparing a published sector cost with an ASIC’s sticker price skips these necessary intermediate calculations.
Calculate the electricity-only threshold separately
For the same illustrative machine, $7.84 of revenue after pool fees divided by 84 kWh gives an electricity-only threshold of about $0.09333/kWh. Including the hypothetical 5% auxiliary load changes the denominator to 88.2 kWh and the threshold to about $0.08889/kWh. Neither figure covers the $100 fixed charge, equipment purchases or other costs. Changing pool fees or hashprice requires recalculating the numerator; changing the measurement boundary requires recalculating the denominator. Keep this tariff threshold separate from a company’s cash cost per BTC: one divides daily dollars by daily kilowatt-hours, the other divides period costs by period coin output. Their units and purposes differ.
What to record before the next comparison
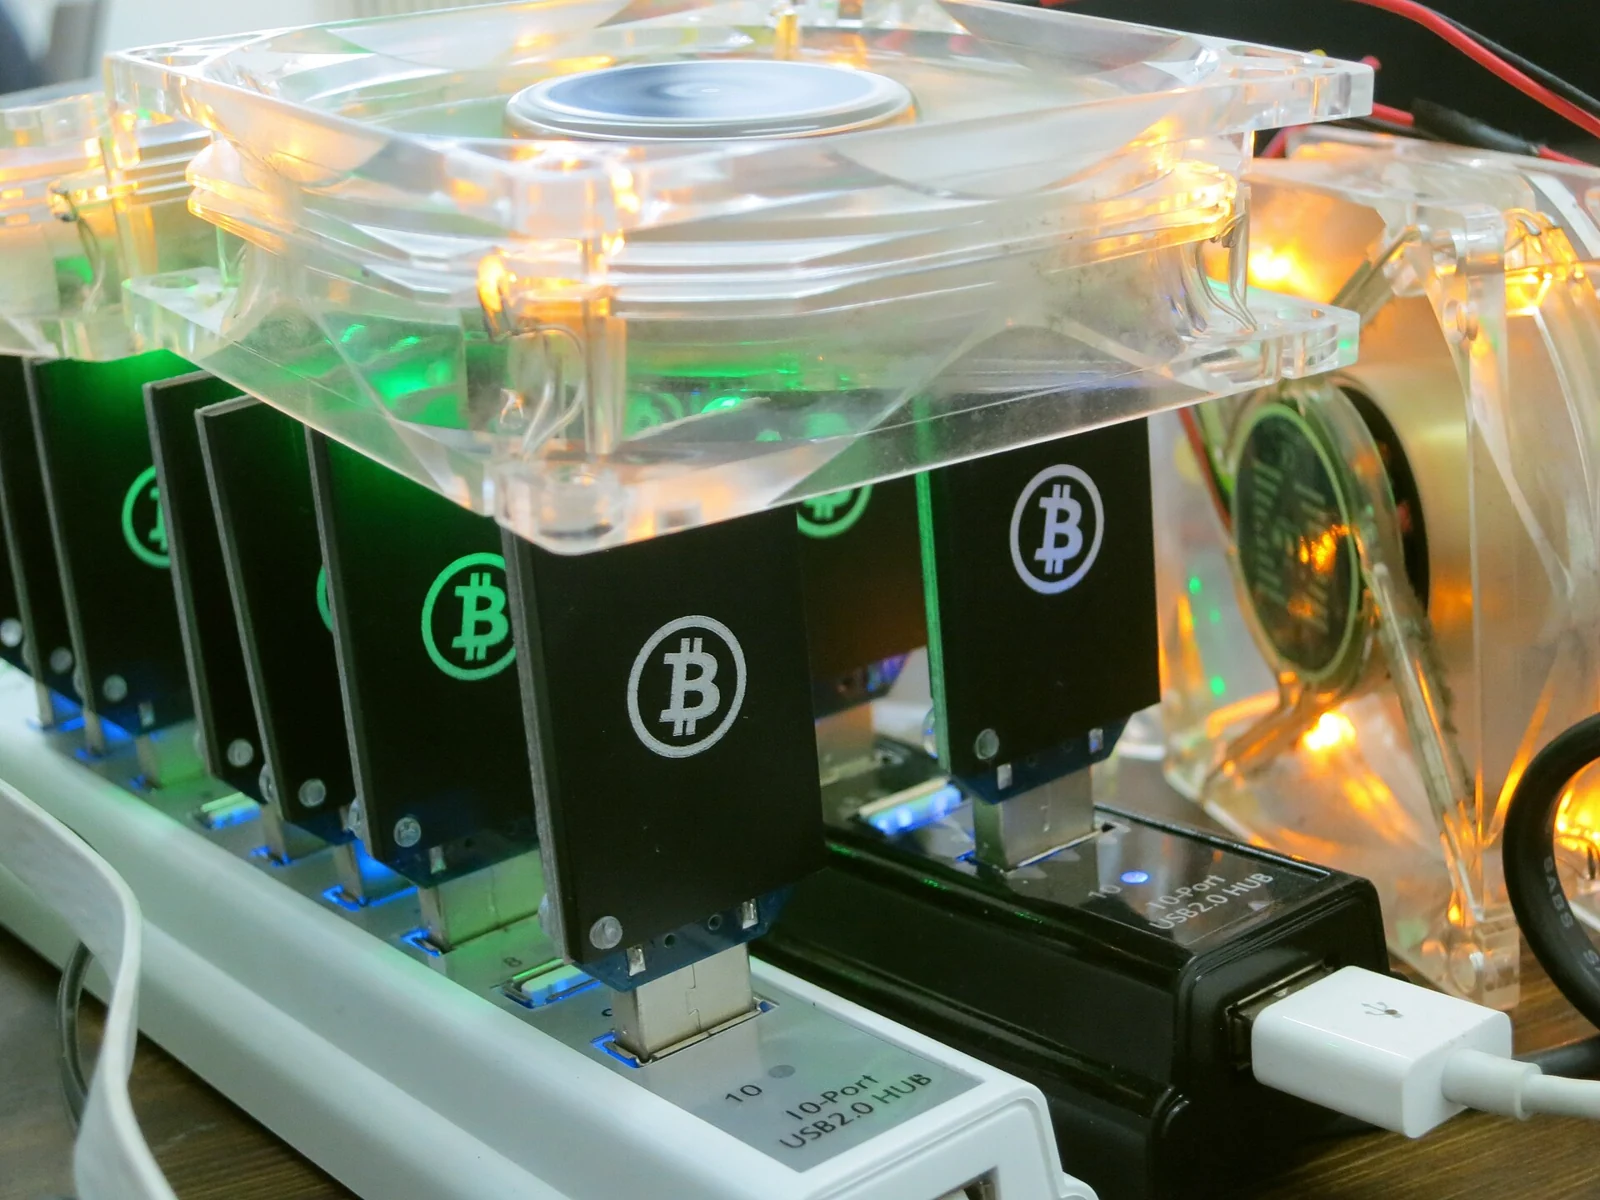
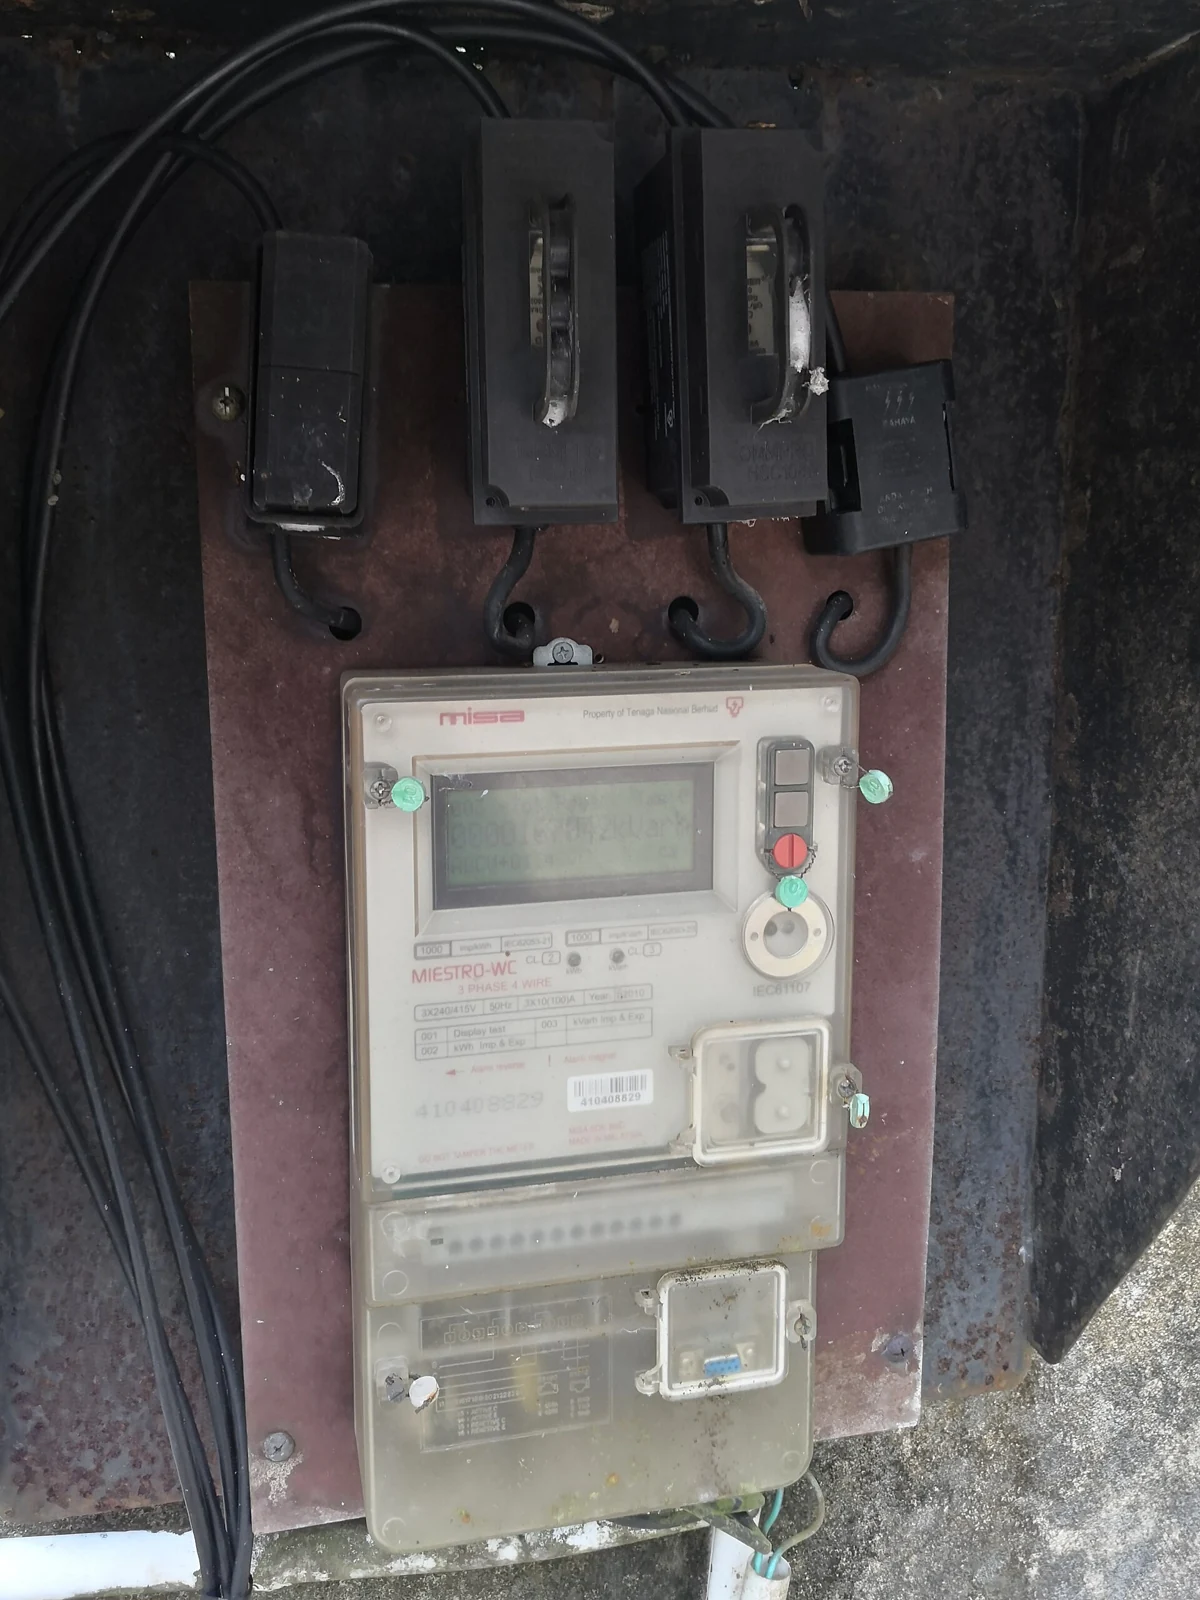
A farm record should connect metered energy, productive hours, accepted hashrate, pool fees, coin output and recurring expenses to the same period. Keep coins mined separate from coins bought or sold from a treasury, and document any currency-conversion assumptions. Use the report as a dated reference, then substitute the farm’s own inputs in the calculator and My Farm. A higher or lower corporate average cannot by itself prove that a particular machine should run or stop. The photographs are licensed archival illustrations of equipment and electricity measurement, not audited facilities from the report.
Source: CoinShares ↗
Mining calculator ↗