New solo-mining census counts 17,086 Bitaxes: the group’s chance is not yours
Source report: 2026-10-26 · Editorial analysis published: 2026-10-26
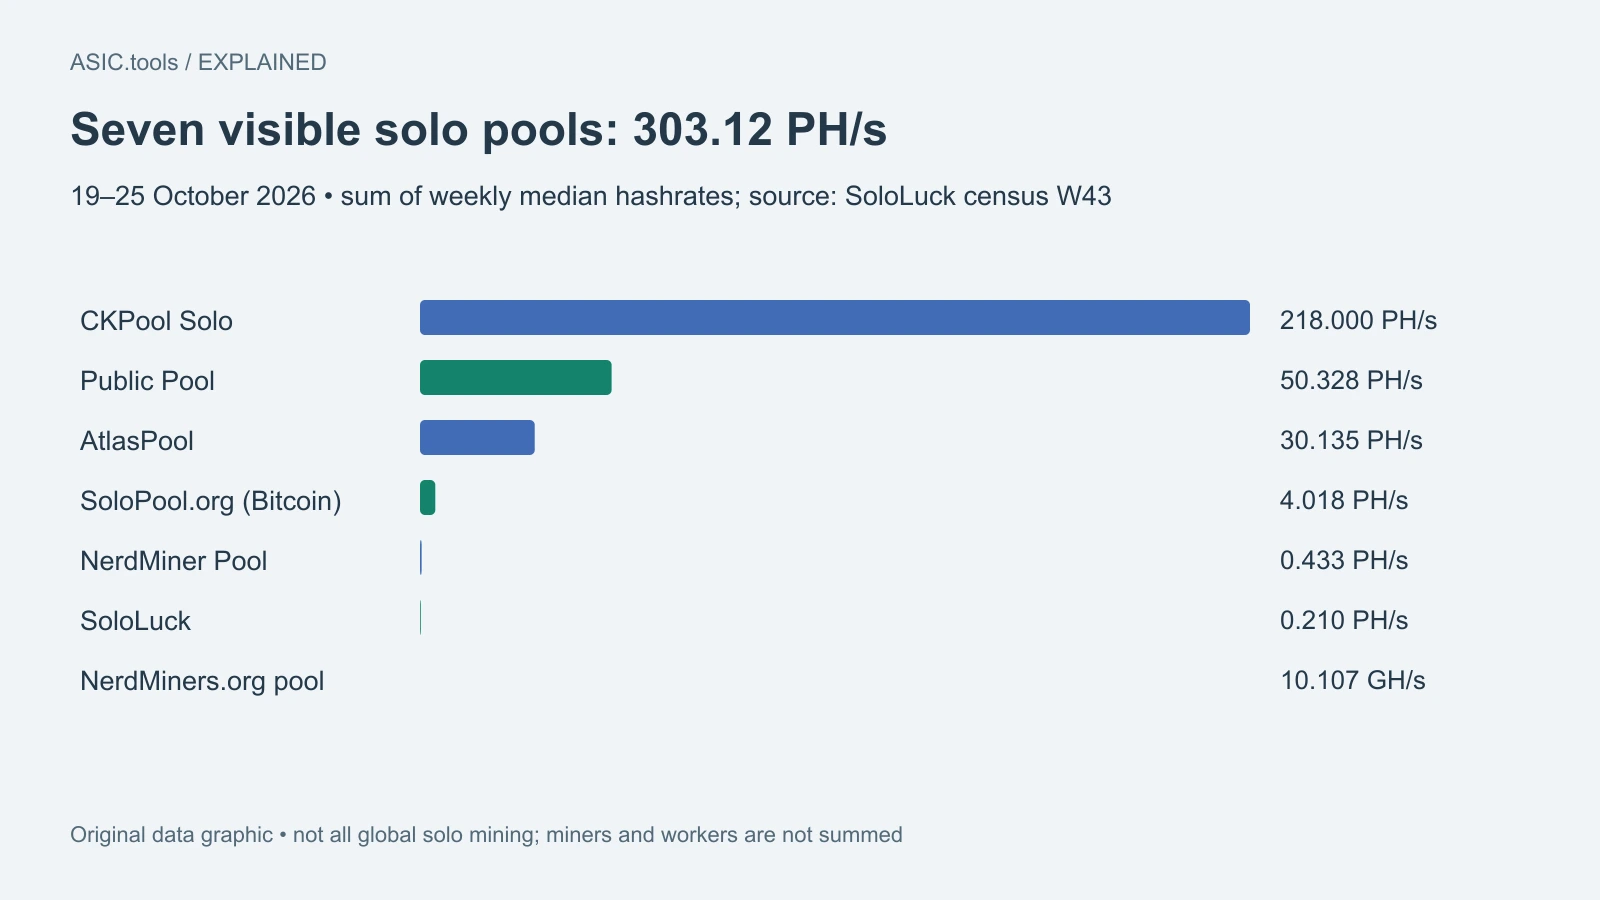
The October 26 W43 edition reports 303.12 PH/s across seven visible solo pools. Its 11.4% monthly lower-bound estimate concerns a monitored home-miner group, not each device.
A new weekly snapshot of small miners
SoloLuck published the W43 Solo Mining Census on October 26, covering October 19–25. Its seven pools with public statistics reported a combined 303.12 petahashes per second, or PH/s, when their weekly median readings are added. The new edition was frozen at 00:07:02 UTC after 168 hourly collection rounds.
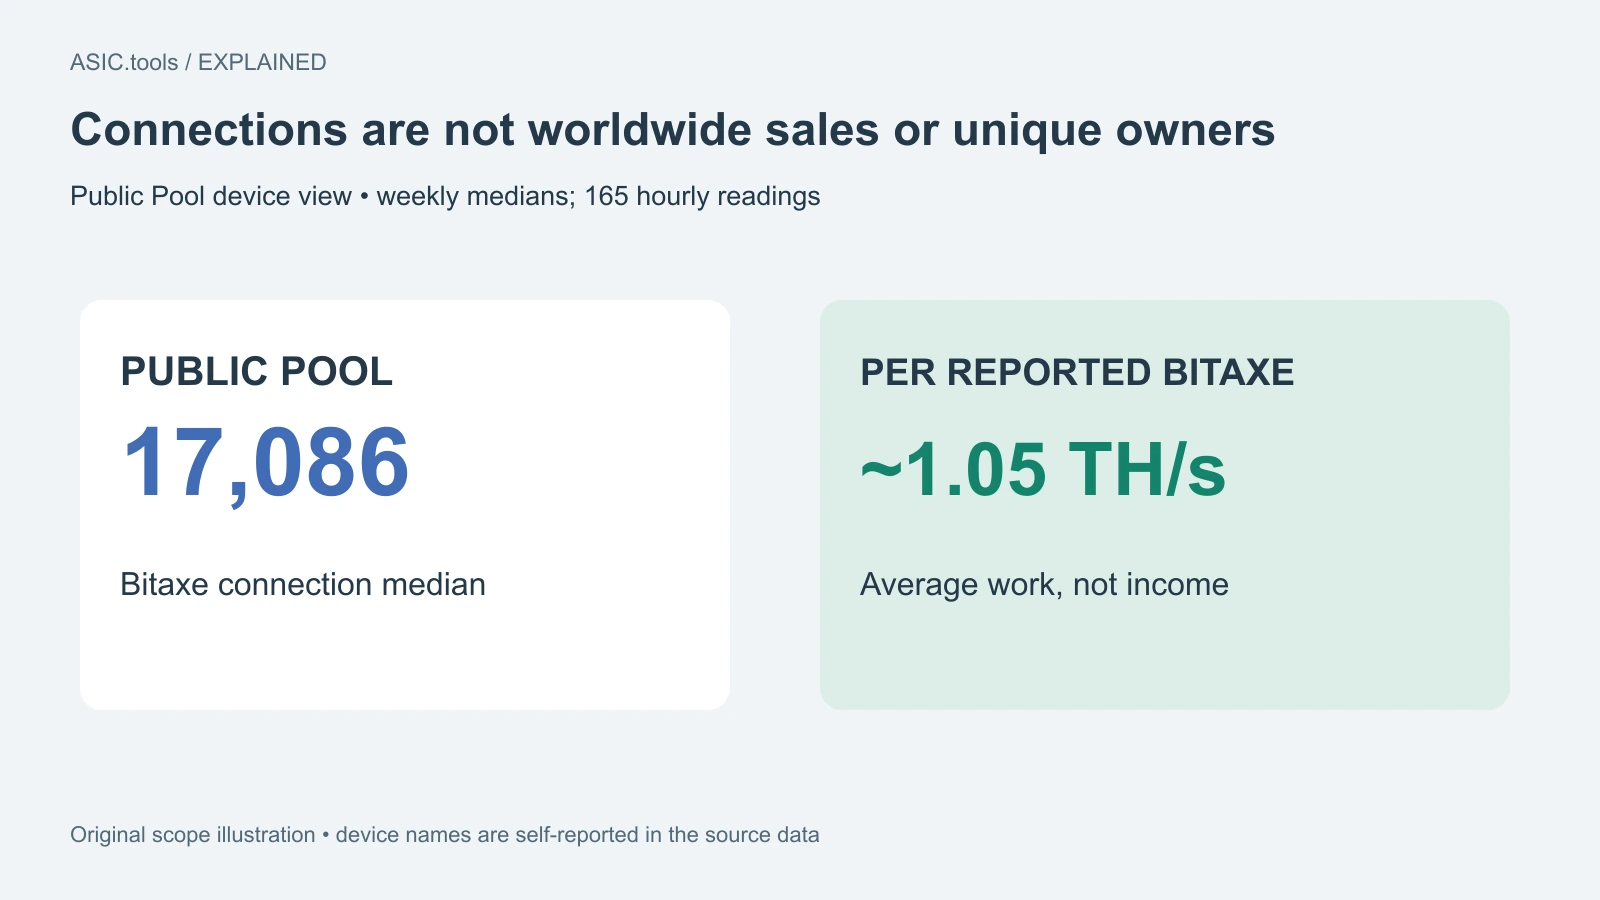
The device view, taken from Public Pool, lists a median 17,086 connections reporting the Bitaxe name and average work of about 1.05 terahashes per second per device. These are observations of connected devices in that source, not worldwide Bitaxe sales, a count of distinct owners or an inventory of every home miner.
The publisher operates one of the measured pools, SoloLuck, and discloses that interest. Its own pool is included under the same public-feed approach and still had no published Bitcoin block in the edition. The census is useful evidence with a stated scope, not a reason to endorse its operator or move a miner automatically.
More visible work than the previous week
The previous W42 file reported 278.44 PH/s across the same seven listed pools. Comparing the unrounded data gives an increase of about 8.87% in the sum of weekly medians. That describes the observed feeds; it is not proof that total global solo mining, or the number of people taking part, grew by the same percentage.
Public Pool’s Bitaxe connection median rose from 16,765.5 to 17,086. A median is the middle reading in the series, so a half-device figure in a weekly summary is a statistical result rather than a physically divided machine. Connections can also move between pools without representing new hardware.
The two editions use different network-difficulty medians. Those medians affect the probability model as well as the observed group’s computing power. More devices alone therefore cannot establish that a particular miner’s chance improved; the comparison has to include the network they are competing against.
What the 11.4% number actually describes
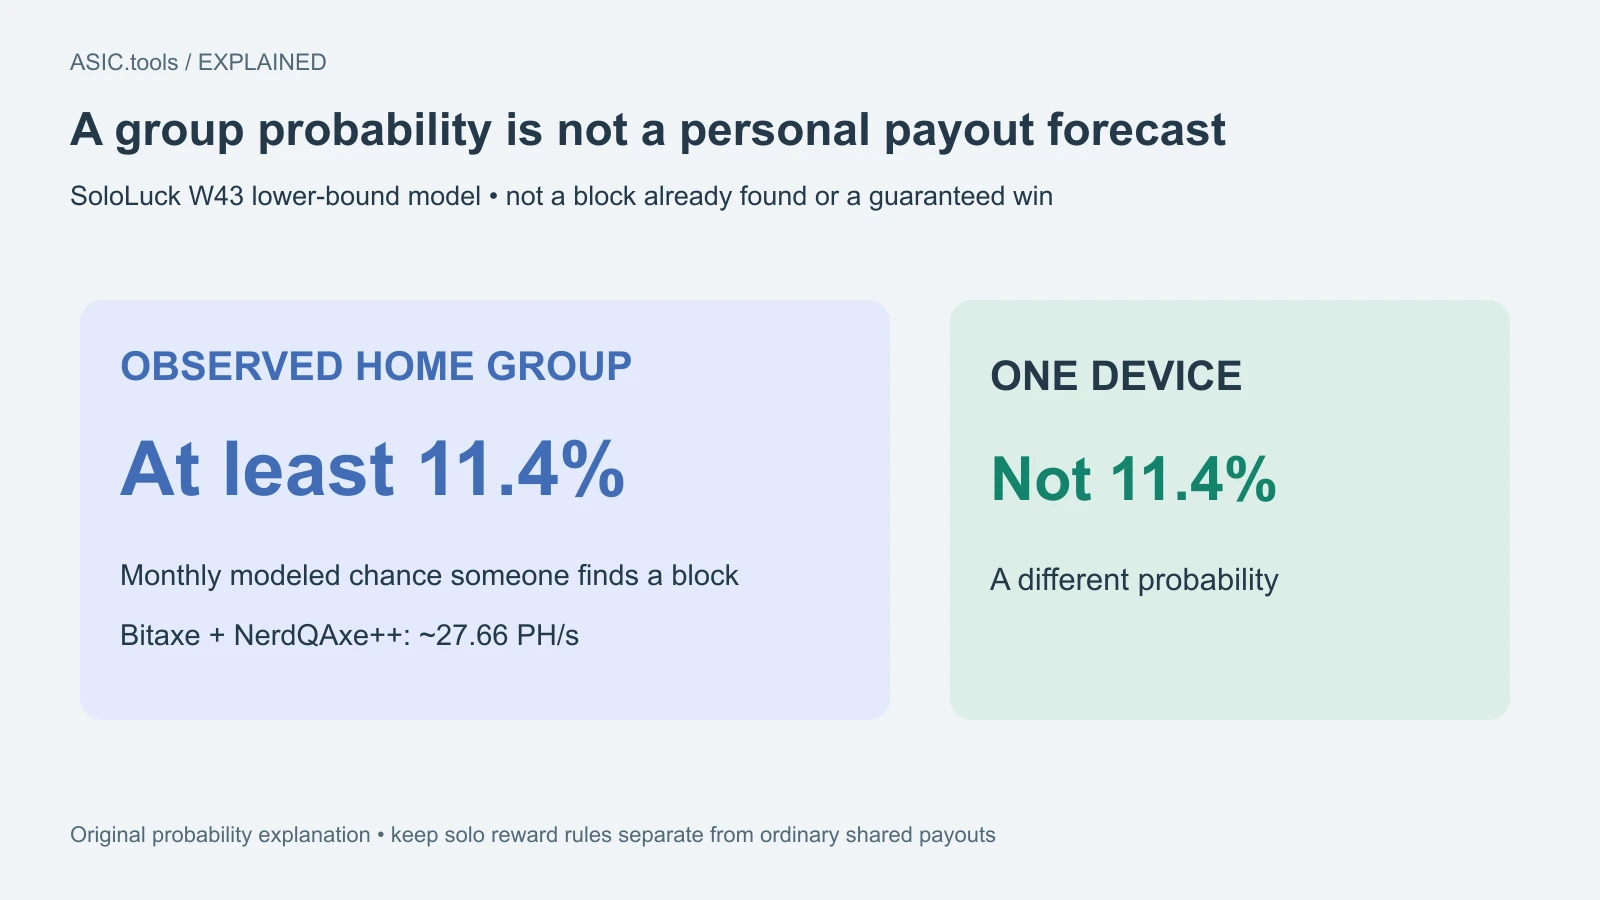
W43 gives a lower-bound monthly estimate of at least 11.4% that a home miner in its observed group finds a Bitcoin block. Its calculation uses the monitored Bitaxe and NerdQAxe++ families, with combined work of about 27.66 PH/s. It does not apply that percentage to every individual machine or to all 303.12 PH/s in the table.
Imagine many people each holding a few lottery tickets. The chance that somebody in the room wins can be much larger than the chance of one named person winning. The census’s group figure is closer to the first question. It does not tell an owner of a single 1.05 TH/s device that they have an 11.4% chance this month.
The lower-bound description reflects the limited families and visible data used by the study; it is not a guarantee that someone will win. The estimate is a model based on observed computing power and difficulty, not a report of a block already found or a calendar promise for the next reward.
A solo pool is still solo
A solo pool supplies shared connection and block-building infrastructure while leaving the block reward to the successful finder under its rules. Its total hashrate can improve the chance that someone connected there finds a block, but it does not turn every participant’s electricity use into a regular proportional payment.
This differs from an ordinary shared-reward pool, where credited work earns a share under a particular settlement method. Before comparing fees or choosing a connection, check which arrangement applies. A zero pool fee does not remove the possibility that an individual receives no block reward for a very long time.
Small accepted shares show that a device is doing valid work at the pool’s chosen reporting difficulty. They are not miniature Bitcoin block rewards. Likewise, a particularly difficult best share is an interesting record, but it does not make the next independent attempt closer to a guaranteed block.
The table has useful limits
Not every feed was readable in every collection round. W43 reports 167 of 168 hours for CKPool’s total and 163 of 168 for Public Pool; device-family statistics use 165 hourly readings. The overall 168-round coverage should not be mistaken for complete coverage of every source at every hour.
The census deliberately does not add miners or workers across pools because those fields count different things. An address, a connected device and a named worker are not interchangeable units. Its CKPool endpoint table is also kept separate from the pool total so regional endpoints are not counted twice.
Braiins Solo appears as a service without a public statistics endpoint found by the census, rather than as zero hashrate. Private solo setups and other unobserved services are outside the sum. These boundaries explain why the report is a visible sample and why its totals cannot be presented as all solo Bitcoin mining.
What a home owner can take from it
The new edition shows a substantial community running small devices, while keeping the financial outcome uncertain for each participant. A home owner can use that scale as context and still budget electricity as a real recurring cost. The possibility of a large block reward is different from dependable monthly income.
When assessing a setup, separate the enjoyment or educational value from a plan that needs regular money. Check the actual power at the wall, the pool’s finder and fee rules, and the address that will receive any reward. Do not borrow a group probability from a chart to justify a personal payback schedule.
This report is a new frozen weekly dataset, not a replacement for live pool status. Its files are published under CC BY 4.0, and our illustrations identify the source and observation window. Subsequent pool moves or block discoveries can change the live picture without changing what the October 19–25 edition measured.
Source: SoloLuck.io ↗ · Frozen W43 data, CC BY 4.0 ↗ · Census methodology and coverage ↗ · Previous W42 data for comparison ↗
Mining calculator ↗