McKinsey scenario projects 24% annual growth in data-center electricity demand to 2030
Source report: 2026-09-30 · Editorial analysis published: 2026-10-07
The September 30 Global Energy Perspective report is receiving fresh coverage this week. Its Continued Momentum growth estimate is a scenario, while grid readiness remains a separate constraint.
Analysis and practical implications
This section is our analysis and illustrative calculations, separate from the source report.
A newly reviewed report with its original date retained
McKinsey’s Global Energy Perspective 2026 is dated September 30. Its Continued Momentum scenario projects compound annual growth of 24% in data-center electricity demand through 2030. We reviewed the original interactive report after fresh October coverage drew attention to it. The article retains the report’s actual date; this is not a claim that McKinsey released a second report today. The projection concerns a defined scenario and does not establish that a particular data center has received power or that every planned campus will be built.
Our analysis starts with the difference between demand for an energy service and the infrastructure available to supply it. A forecast can describe how much electricity computing businesses would seek, while interconnection and equipment readiness determine what can actually be consumed at a site. These quantities meet only when projects obtain usable capacity and operate. Treating a demand projection as a count of energized megawatts skips that sequence and can make a development pipeline appear more complete than the evidence supports.

Compound growth is not a fixed increment each year
A compound annual growth rate applies to the previous year’s level rather than adding the same absolute amount every year. To illustrate the reported rate independently, an index starting at 100 and increasing by 24% annually would become 124 after one year and about 153.8 after two. After four years it would be about 236.4. This is a unitless arithmetic illustration, not the report’s stated starting demand or an estimate of the electricity consumed by a named company.
The example matters because a percentage can be copied into a budget as if it were a fixed annual increment. Adding 24 index units each year would produce a different trajectory from compounding. It also matters to keep the base year visible: applying the same growth rate across a different number of years changes the outcome. Our coverage does not invent an absolute energy total from the headline. An absolute forecast needs the original starting level, time interval, geographic scope and scenario assumptions in addition to the percentage.
Energy use and available power need different units
Power is the rate at which electricity is used; energy is the accumulated amount over time. A hypothetical site drawing a constant 1 MW for twenty-four hours uses 24 MWh. That does not mean every site with a 1 MW connection consumes that amount daily. Utilization, outages and changes in workload alter the total. Our analysis uses this independent example to show why a forecast of electricity demand cannot be compared casually with the maximum connection rating of a campus.
A project comparison should retain both dimensions: usable electrical power at the relevant boundary and expected consumption over the chosen period. Hardware and cooling design determine what loads can fit within the available power. Operating hours determine accumulated energy and much of the bill. A forecast can inform long-term planning without establishing either figure for an individual project. This distinction is also important when an infrastructure announcement reports generation capacity, campus capacity or IT load using different measurement boundaries.
Grid readiness is a separate commissioning test
The report identifies infrastructure readiness as a constraint on the energy system’s development. Our interpretation for computing operators is practical: low generation costs do not establish a completed connection, a delivered transformer or a commissioned distribution chain. Those are distinct project milestones. A campus announcement can reserve land and describe intended demand while important parts of the electrical route remain unfinished. Project reviews should therefore ask which capacity is contracted, which is physically installed and which is available for the workload under consideration.
The useful evidence includes the approved connection point, the equipment delivery schedule, installation testing and the date at which the customer can take the agreed load. This does not mean every project faces the same bottleneck or that the report proves a delay at a specific site. Our analysis is that an operator should track readiness directly rather than infer it from a regional demand forecast. The electrical route can be the limiting factor even when financing, computing equipment and customer demand are otherwise present.
A scenario is a planning instrument rather than a guarantee
The original report presents multiple energy futures. Its growth estimate should remain attached to the scenario in which it appears, with a distinction between extrapolated trends and an observed operating result. Our reading is that scenario analysis is useful when it makes a decision’s dependencies visible. It is less useful when one headline value becomes a guaranteed sales forecast, a universal electricity-price prediction or a reason to assume that all competing workloads will expand at the same pace.
A computing business can test different outcomes without claiming that any one must occur. The same hardware order may look acceptable under one combination of electricity price and utilization and fail under another. A development contract can also leave capacity available later than the demand model assumes. These are independent decision considerations. They do not add new numerical forecasts to McKinsey’s report. Keeping several operating cases visible helps a reader understand the uncertainty rather than hide it behind a single compounded percentage.
ASIC mining and AI computing require different operating comparisons
An electricity-demand forecast for data centers does not directly predict Bitcoin hashprice or the income of a mining machine. SHA-256 mining and AI services earn revenue through different markets and use different equipment. Their shared dependence on electrical infrastructure makes the report relevant to miners, but it does not make their revenue metrics interchangeable. Our analysis is that operators considering a workload change should compare the complete requirements of both activities, including cooling, networking, customer obligations and the control of interruptions.
A site that can accommodate a mining fleet is not automatically ready for every AI installation. Conversely, an AI project’s demand does not establish that existing miners will be displaced at a particular location. The right comparison uses the actual facility layout and contractual allocation. This article therefore does not assign a GPU-rental price, an ASIC return or a conversion payback from the report’s growth rate. Those outcomes need separate evidence about the devices, customers and operating expenses involved.
Buying equipment before usable capacity creates a timing exposure
A hypothetical fleet purchased months before its connection is ready can incur storage and financing costs without producing useful work. A connection completed before equipment arrives can leave contracted capacity unused. These are general timing exposures, not measured outcomes from the report. Our interpretation is that a power-demand scenario should lead buyers to examine the sequence of their own commitments: deposits, deliveries, installation, testing, energization and the first period of billable or accepted computing work.
The decision is not simply whether long-term demand is high. It is whether a particular asset can be commissioned and utilized under its own schedule and costs. A supplier’s expected delivery date should be separated from a guaranteed date and from the date on which the operator can actually start. Keeping those milestones in one project record makes the forecast more useful. It also prevents a demand-growth headline from obscuring a near-term mismatch between the equipment ordered and the electrical capacity available to run it.
The evidence to watch after the forecast
The informative follow-up is measured consumption, commissioned capacity and documented changes in project schedules. These can show how actual deployments compare with the scenario without pretending that a single announcement settles the long-term trajectory. The original interactive report is linked for its assumptions and context. We retain the September date and describe the current article as a fresh review of that source, so publication timing does not become confused with the timing of the research itself.
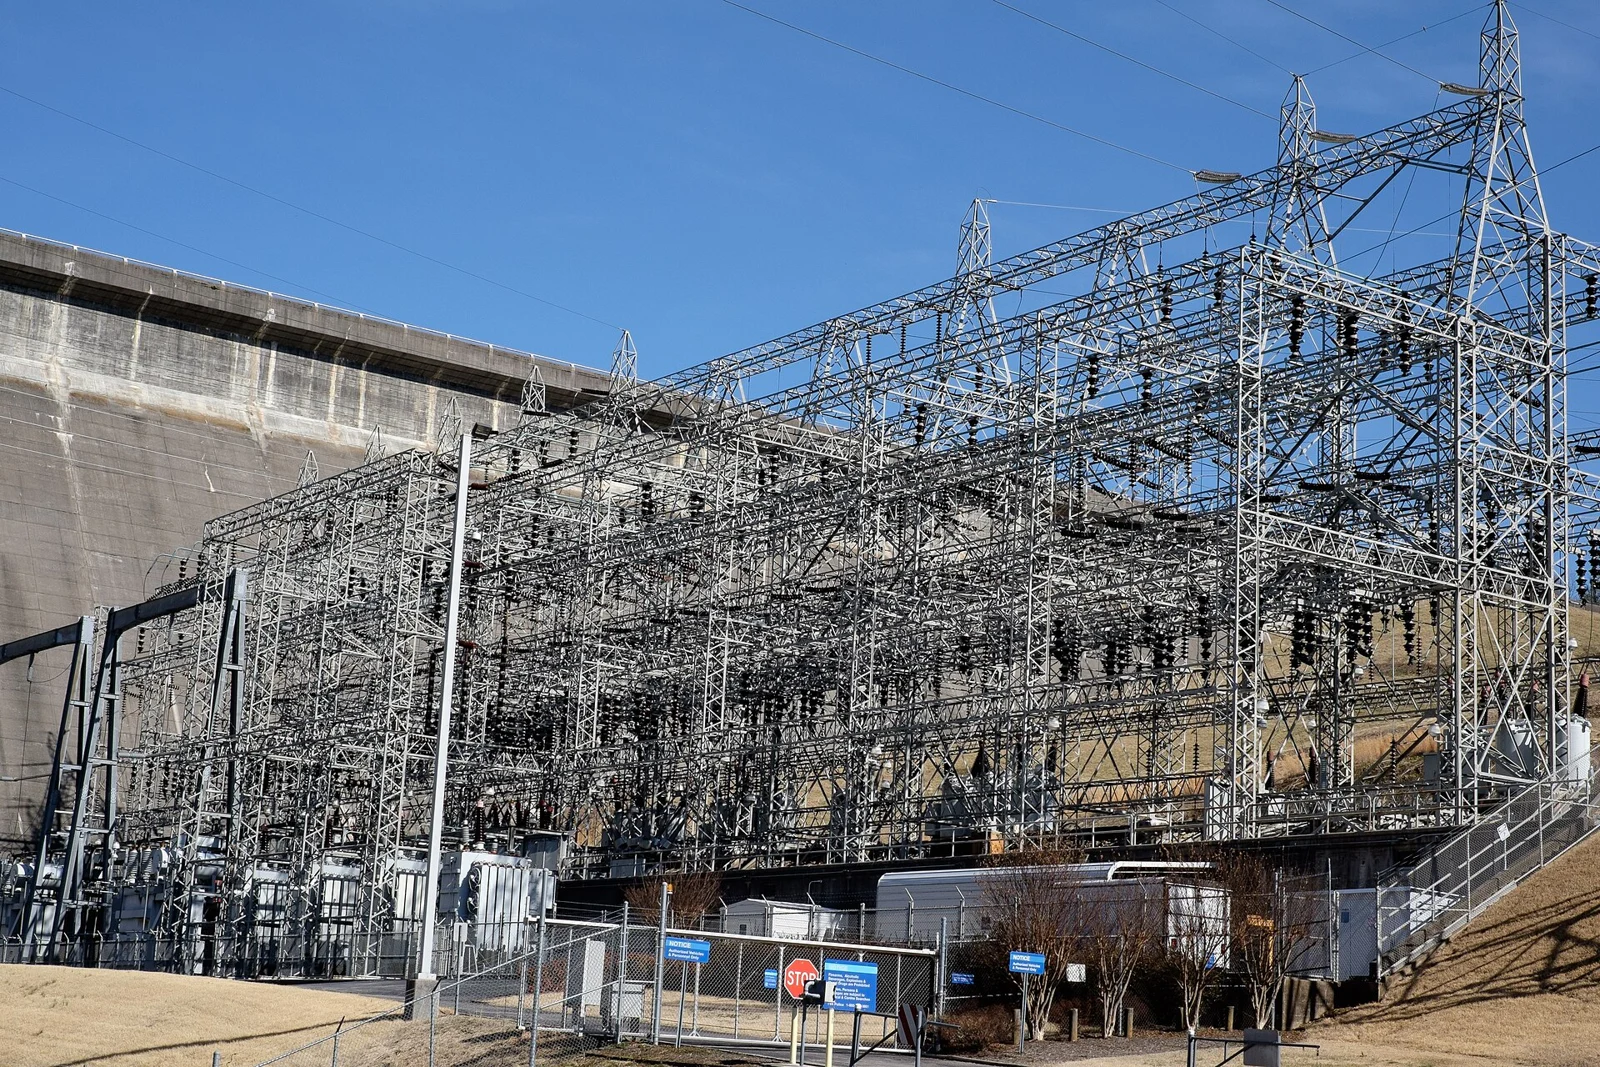
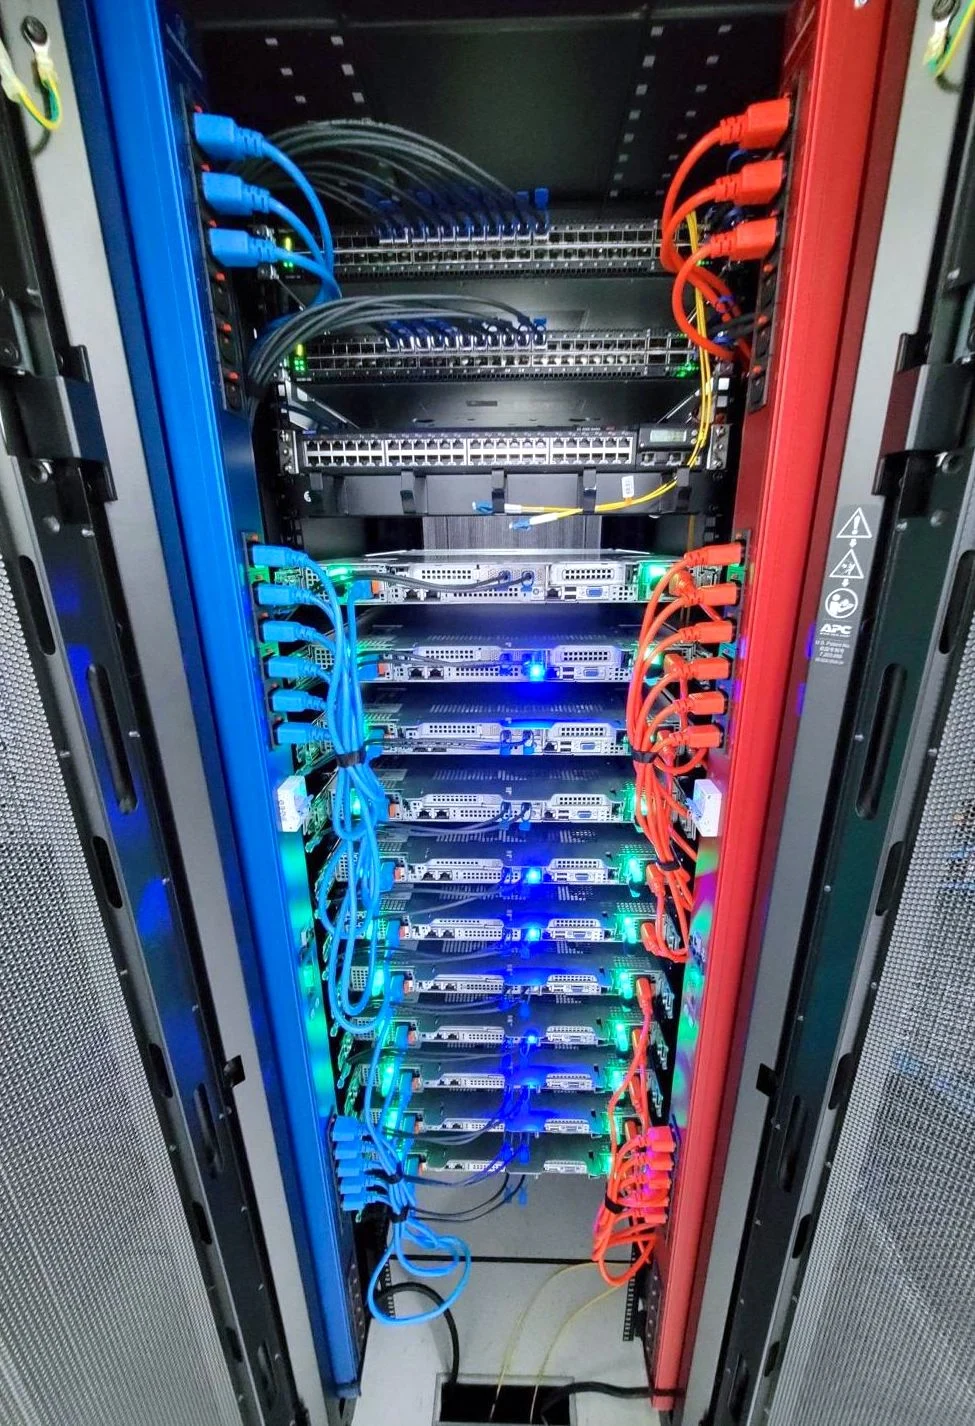
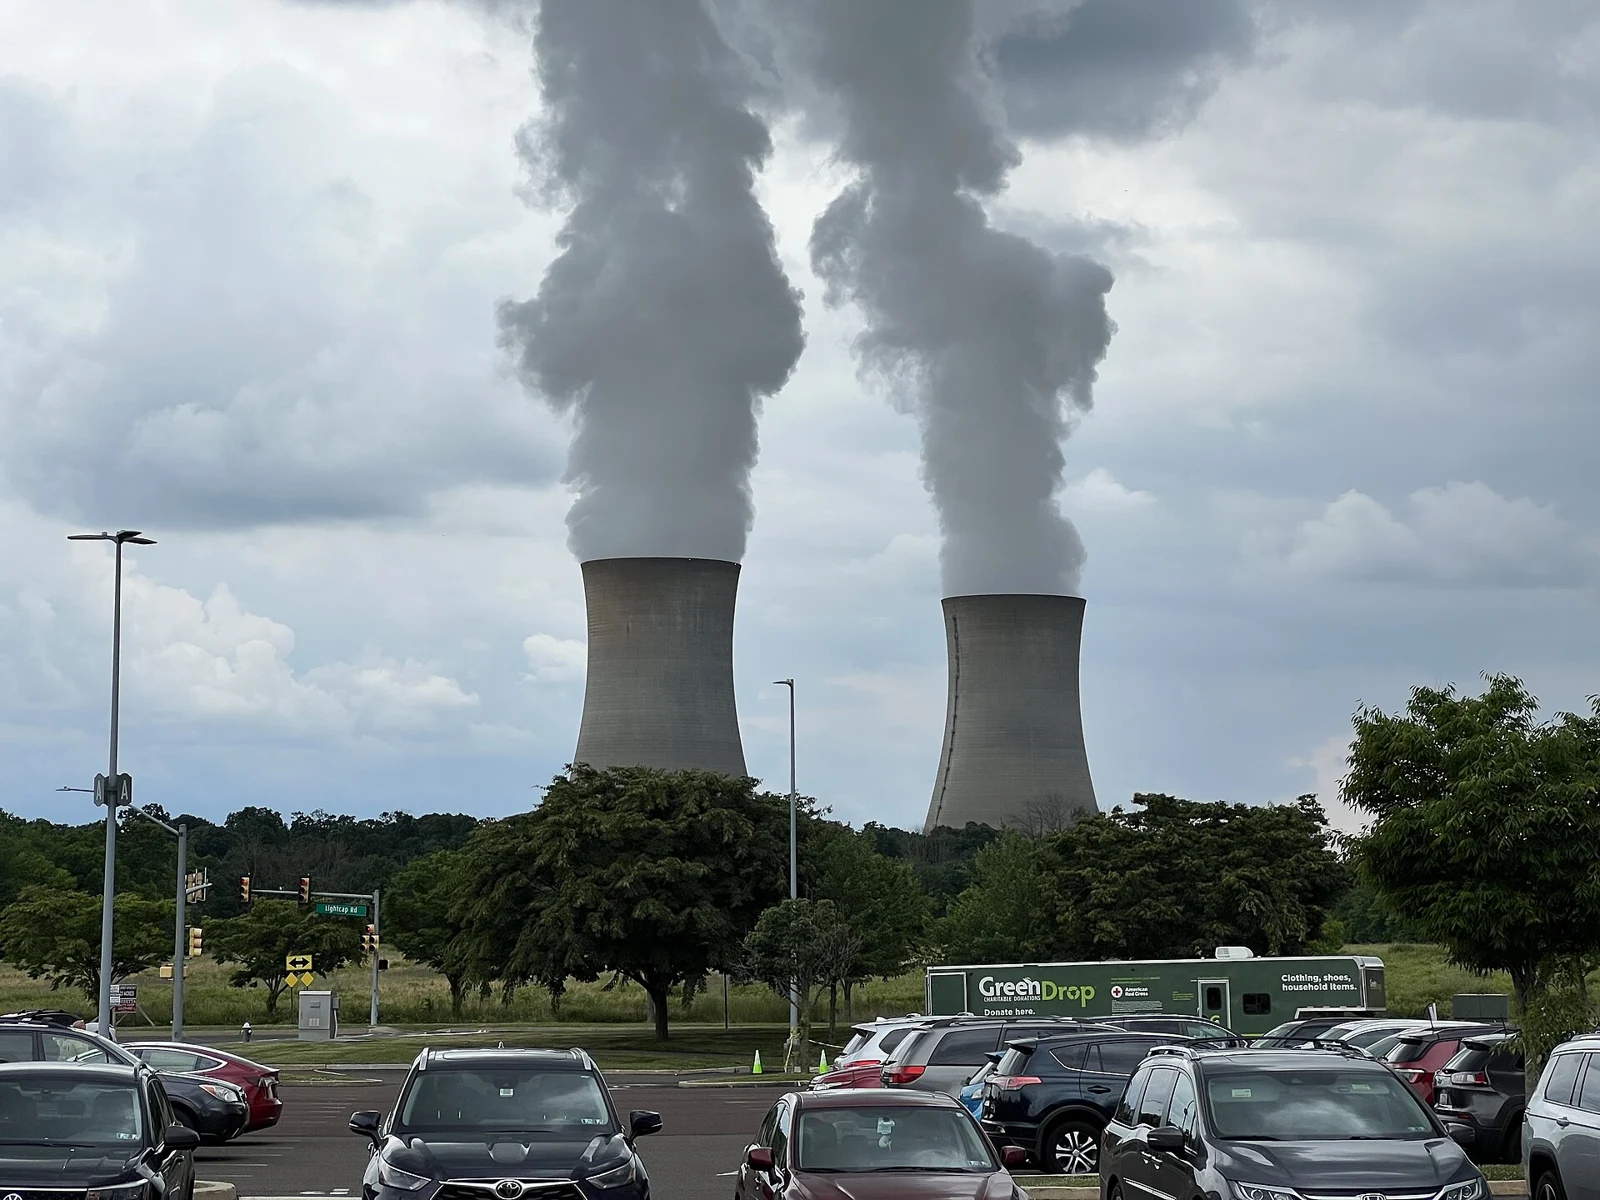
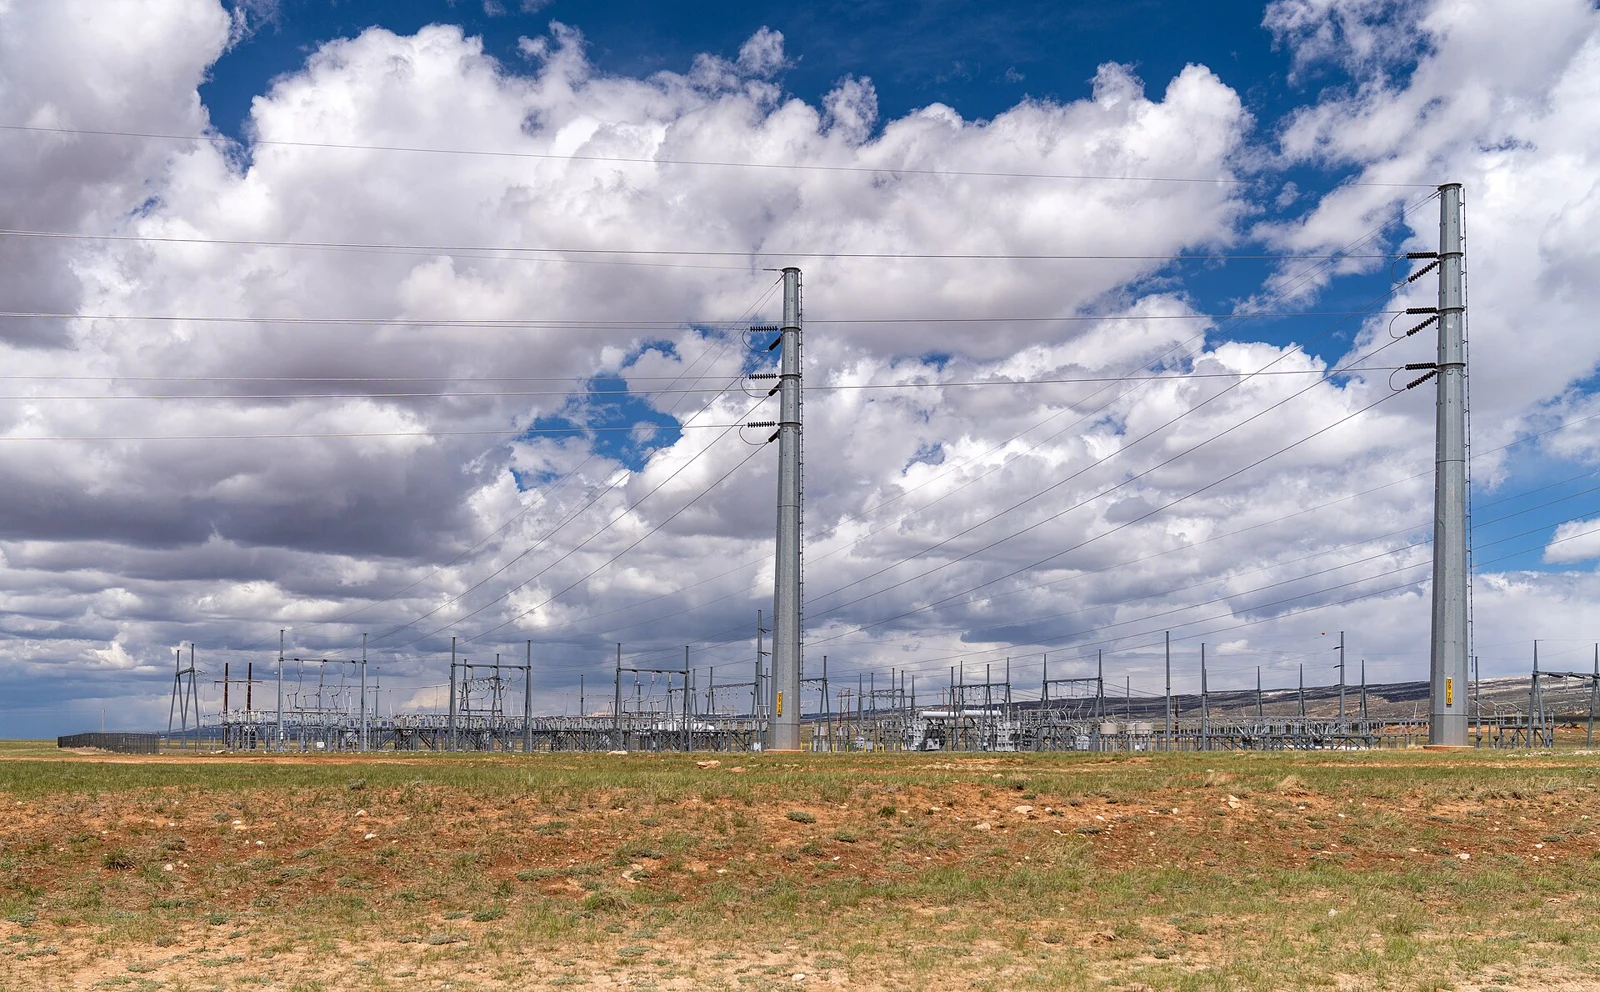
For miners, the actionable lesson is to compare contracts and measurements at matching boundaries. A device’s watts, a site’s megawatts and a year’s megawatt-hours describe related but different quantities. A regional scenario can inform a capacity search while an actual utility agreement and commissioning record determine whether a farm can operate. Our analysis makes those connections explicit, with independently labelled arithmetic examples and archive illustrations that do not claim to depict McKinsey projects or newly energized data centers.
Source: McKinsey & Company ↗
Mining calculator ↗