Luxor September review: difficulty absorbs most of Bitcoin’s gain
Source report: 2026-10-09 · Editorial analysis published: 2026-10-10
Luxor’s October 9 review reports September closing hashprice of $39.92 per PH/s/day and a 5.52% difficulty increase. The month’s average revenue rate is distinct from its closing observation.
Analysis and practical implications
This section is our analysis and illustrative calculations, separate from the source report.
A new monthly mining-market review
Luxor published its September 2026 Hashrate Lookback on October 9. It reports a 7.3% rise in Bitcoin from the month’s open to close, while dollar hashprice ended at $39.92 per PH/s/day, up 1.8%. Network difficulty increased by 5.52% across two upward adjustments. These are dated September observations, not live quotations. The new report explains why a stronger coin price did not translate into a similarly large increase in mining revenue per unit of hashrate.
Our operating analysis uses that distinction to compare revenue, electrical consumption and risk at the level of a farm. A price change alone cannot describe a miner’s cash flow. The amount of accepted computational work and the revenue paid for that work both matter. Preserve the measurement interval when importing a market figure into a spreadsheet, and separate the historical observation from an assumption about the next month.
Closing value and average settlement
The report gives average September dollar hashprice of $39.33 per PH/s/day. Its seven-day network hashrate estimate rose from 926 to 975 EH/s over the month. The monthly average BTC hashprice was 0.00048965 BTC per PH/s/day, down 2.0%. An average and a closing observation describe different parts of a time series, while BTC and dollar denomination answer different questions. Our interpretation does not use a dollar gain as evidence of a gain in coin-denominated production.
When building a historical profitability comparison, a period average can be useful for a first approximation, but it still cannot reproduce every pool payment. A farm may have operated more hours on some days than others. If its accepted hashrate changes within the month, a simple average market rate loses that timing information. Use interval-by-interval revenue and work records where available; label a constant-hashrate calculation as an estimate rather than a reconstruction of actual settlements.
A worked revenue scenario
For an independent example, a hypothetical 200 TH/s machine supplies 0.2 PH/s. Multiplying that capacity by the reported September average gives approximately $7.87 per day before operating costs and pool deductions, assuming full delivery of the stated hashrate. Using the month-end rate instead gives about $7.98. Neither result is net profit or a current earnings quote. The difference demonstrates why the chosen observation affects a calculator result even when the hardware input stays unchanged.
Now assume that the same hypothetical device draws 3.5 kW continuously. Its daily device energy would be 84 kWh. At an illustrative tariff of $0.05 per kWh, device electricity would cost $4.20 per day, leaving about $3.67 from the average-rate scenario before other costs. These invented hardware and tariff inputs are examples, not specifications attributed to Luxor or a named model. Cooling, fees, repairs and downtime would need their own entries.
Revenue pressure can arrive through competition
Bitcoin mining distributes rewards across competing work. A hardware owner can therefore see revenue per unit of hashrate change without changing the machine’s nominal rating. A rising network difficulty is relevant to that competition, but an individual farm’s results also depend on operating time, accepted shares and its reward arrangement. Do not turn a market-wide change into a diagnosis of device failure. Check the local logs and pool observations before assigning a revenue decline to an electrical or cooling problem.
A useful farm dashboard keeps nominal hashrate, observed local hashrate and pool-accepted hashrate distinct. It also retains the same start and end times for meter readings and payments. That makes a device problem easier to distinguish from a market change. An aggregate network estimate is not a census of specific models: it cannot reveal which manufacturer gained share or establish a new ASIC release. Catalogue additions still require model-specific evidence.
Efficiency and tariffs determine the remaining margin
Electrical efficiency is important because energy cost is attached to the delivered work. For a controlled comparison, hold the hashrate and measurement period constant while changing watts or tariff. If an electricity rate includes demand charges, connection charges or a time-of-use schedule, a single energy price may omit a material part of the bill. Calculate the relevant charges explicitly rather than treating every site as if it bought a flat-rate residential electricity product.
Device watts and site watts may have different boundaries. Fans or pumps powered separately, distribution losses and support systems can add to the facility total. Record where the electrical measurement was taken before comparing two installations. A firmware efficiency figure can be useful for a device profile, but it does not establish the farm’s whole-site cost. The September review supplies a revenue reference; it cannot supply an unknown operator’s tariff, installation overhead or realized profit.
Forward prices are a different kind of observation
A forward-market quote describes terms available for a future period under a defined contract. It is not a measurement of future network production and should not be inserted into a historical column. Compare the denomination, contract month and quoted side of the market before interpreting a forward curve. Fees and settlement arrangements can affect a hedging decision even when two headline rates look similar. A market estimate is useful only when its boundary is retained.
For planning, keep a base scenario and stress scenarios rather than one apparently precise forecast. Change the future revenue rate, operating hours and electricity assumptions separately so the source of a margin change remains visible. A hedge can change exposure to a market variable; it cannot guarantee that an offline machine produces work or that a site is commissioned on time. Financial and operational commitments therefore need separate records. This is scenario analysis, not a recommendation to enter a derivatives contract.
How to use the report in ASIC.tools
Use the calculator to compare confirmed model specifications against a clearly dated revenue input. In My Farm, retain the machine count, active power profile and actual tariff. For a past-month comparison, choose a historical rate and label its period. For a live assessment, obtain a fresh market observation. Replacing an old value with a new one should update the observation date as well; otherwise the number may look current while describing an earlier operating environment.
Compare a proposed hardware upgrade on the same assumptions for both the existing and replacement equipment. A lower energy requirement can improve an operating comparison, but the purchase price, installation work and disposal value affect the investment decision. Keep those costs visible and allow for uncertainty in future rewards. A market report cannot establish a payback date by itself. The practical benefit is a better-defined input and a clearer explanation of what changed between observations.
What the September figures establish
The new review provides evidence that coin-price performance and revenue per hashrate moved at different rates in September. Its figures should be read within that month and with their averaging method intact. They do not establish a current net margin for every miner or promise that October will follow the same path. Future difficulty adjustments and farm operating records can change the calculation, so comparisons should be dated and reproducible.
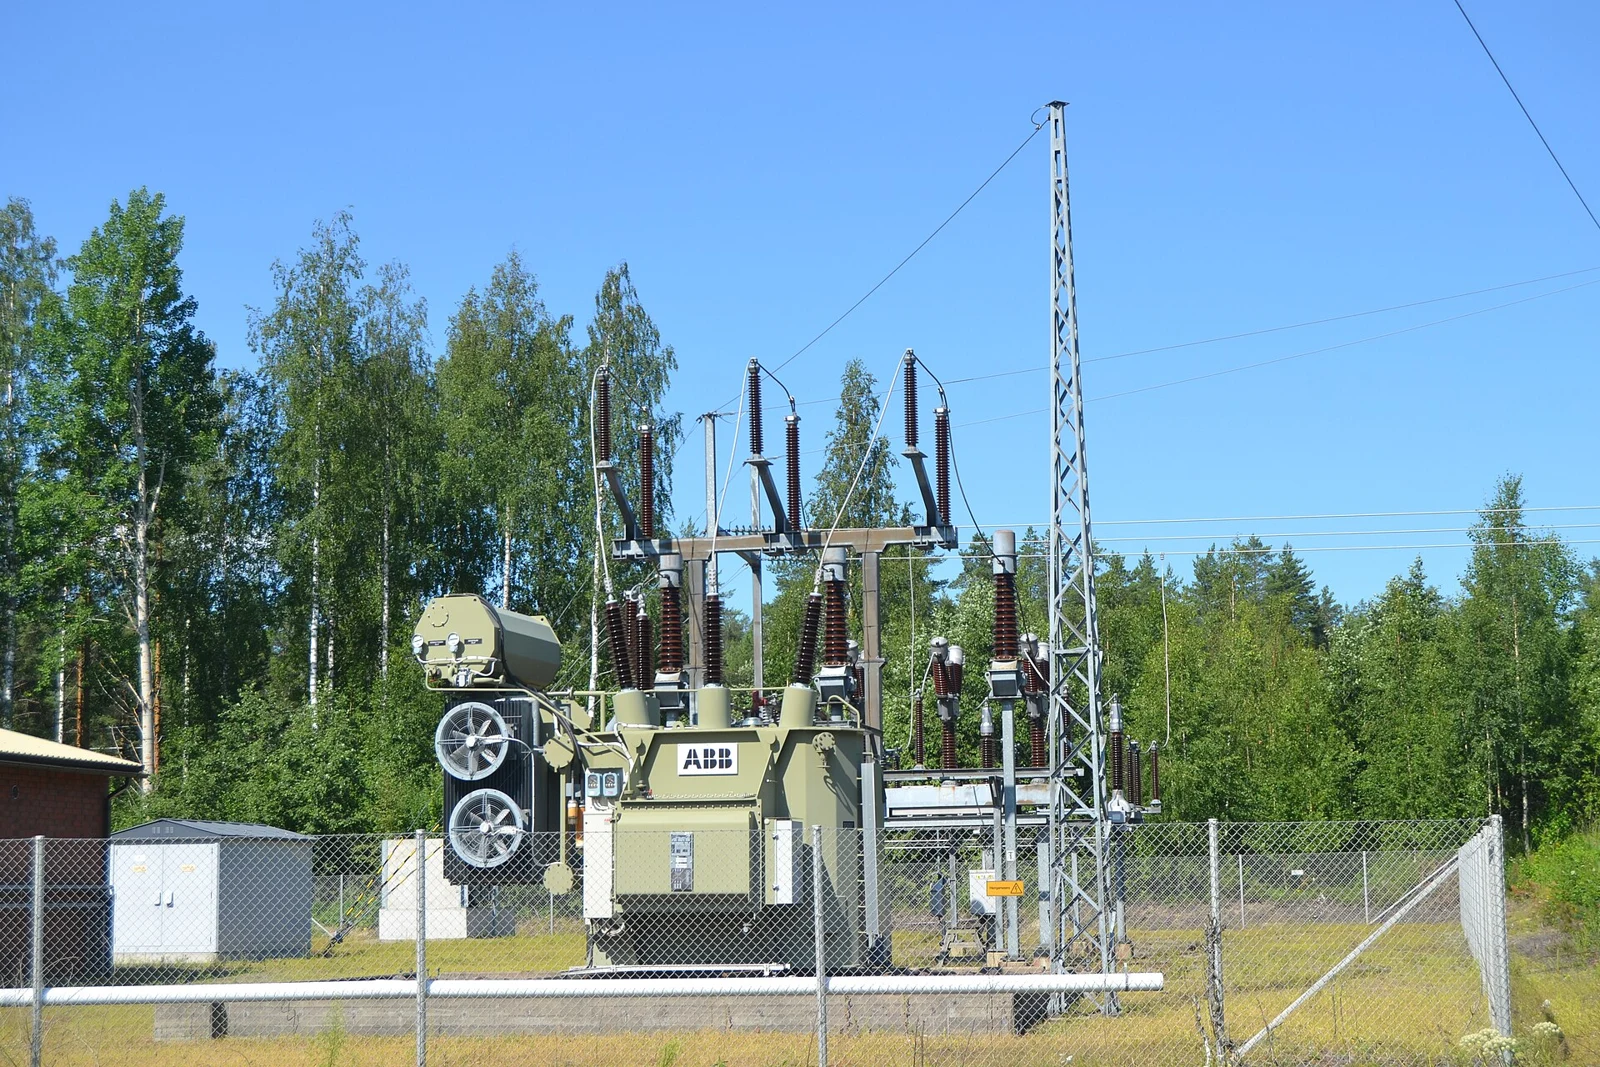
The two licensed archival photographs illustrate mining equipment and electrical infrastructure; they are not images of a newly commissioned Luxor site. The source link preserves the original review and its publication date. Readers can use the report to refine their own scenario inputs, then reconcile estimates with accepted work, pool settlements and meter readings. That sequence turns a headline about Bitcoin’s price into an operating assessment with transparent units and assumptions.
Source: Hashrate Index / Luxor ↗
Mining calculator ↗