CleanSpark mines 529 BTC in September and ends monthly operational updates
Source report: 2026-10-09 · Editorial analysis published: 2026-10-10
The October 9 unaudited report gives 36.0 EH/s average operating hashrate. CleanSpark will move to quarterly reporting; peak capacity and monthly output need separate interpretation.
Analysis and practical implications
This section is our analysis and illustrative calculations, separate from the source report.
The new September operating report
CleanSpark published its September operational update on October 9, 2026. The unaudited figures report 529 BTC mined, average operating hashrate of 36.0 EH/s, operational hashrate of 50 EH/s and 199,745 deployed miners. The announcement also says monthly operating updates will be discontinued as the company moves to standard quarterly reporting. This is a new reporting-period disclosure; it is separate from the financing announcement previously covered by ASIC.tools.
The change in reporting cadence matters because a reader may no longer receive the same monthly picture of production and fleet activity. A longer reporting interval can combine periods with quite different operating conditions. Our analysis explains how to keep comparisons useful when that happens, rather than projecting September output into a guaranteed future result. The company’s published measures should retain their definitions, observation dates and unaudited status when copied into a tracking sheet.
A historical operating peak and a monthly average
The release defines operational hashrate as the highest rate historically achieved concurrently by installed, functional miners with energized infrastructure. That is a different observation from average operating hashrate during the reporting period. The two numbers should not be silently described as if both measured continuous September activity. Our calculation of 36 divided by 50 gives 72%, but this is only the ratio between these differently defined headline figures, not a measured uptime percentage.
An uptime calculation needs a stated denominator: the machines expected to run and the time they were expected to run. A fleet may have different power modes, maintenance schedules or planned interruptions. Hashrate can also vary without a device being completely offline. Keep machine availability, hashrate utilization and pool-accepted work as separate columns. Naming the ratio precisely prevents a useful arithmetic comparison from becoming an unsupported claim that the fleet suffered a particular amount of downtime.
Production is work accumulated over a period
Using the reported monthly total, 529 BTC divided by the 30 days in September gives approximately 17.63 BTC per day. This is our calculation from the rounded total. It is not an independent production measurement. Comparing this daily average with a different month can be more informative than comparing raw totals when the months have different lengths, although it still cannot isolate a change in difficulty, operating time or the performance of any individual machine.
For a mining farm’s own ledger, retain the pool settlement period and distinguish accepted work from coins actually received. Payments may cross a calendar boundary, and pools can use different reward and settlement methods. A hardware inventory records installed equipment, while a wallet records transfers and balances. None of these records should replace the others. Reconcile them before interpreting a monthly change as a hardware improvement, especially when an equipment upgrade and a settlement adjustment occur close together.
Counting machines does not identify a replacement cycle
A deployed-machine count establishes an inventory measure at a reporting date. It cannot, by itself, establish how many units were bought, sold, repaired, stored or replaced during the month. Nor does a fleet-level figure disclose each model’s settings. Avoid inferring a new ASIC specification by dividing an aggregate hashrate by a machine count whose operating coverage may be different. A machine can be installed without contributing its nominal hashrate throughout the period.
An operator tracking a replacement cycle can use a dated inventory with serial number, model, commissioning date, power profile and disposition. Join that with active-device logs and meter readings. This distinguishes a removed older device from a temporarily stopped one and makes the impact of a replacement measurable. Catalogue specifications remain a starting point for planning; an inventory entry and a pool result provide the evidence needed to say what the installed fleet actually did.
How quarterly reporting changes comparisons
A quarterly report can provide a broader financial picture, but three months aggregated into one interval can hide the sequence of operating changes. Record the precise opening and closing dates of each production series. If a later publication supplies only a quarter-wide average, label it that way and avoid filling missing monthly cells with equal thirds. That allocation would be a modelling assumption, not a newly disclosed result, even if the quarter total is reproduced correctly.
For readers maintaining a public-miner dashboard, missing information should be explicit. Use a publication-date field, a reporting-period field and a metric-definition field alongside each value. Keep an earlier observation as a dated historical record rather than relabelling it as current. When the reporting cadence changes, a chart may need a break or a different aggregation level. This helps prevent an apparent trend that is really the result of comparing a monthly average with a quarterly average.
A scenario should disclose its assumptions
Consider an illustrative fleet of 100 identical machines, each rated at 200 TH/s. Its nominal capacity would be 20,000 TH/s, or 20 PH/s. If only 80 machines operate at that profile, their nominal combined capacity is 16 PH/s before pool and uptime effects. This example explains why installed and active quantities differ; it is not a reconstruction of CleanSpark’s equipment, and the hypothetical ratings should never be assigned to its actual machines.
An ASIC.tools calculator scenario can make this distinction visible by recording the active machine count, selected model, electrical power, pool fee and observation period. Use the current device settings for an operating assessment and the manufacturer’s nominal profile for a purchasing comparison. Do not mix those boundaries without saying so. A scenario is useful precisely because its inputs can be changed; it should not be presented as a company result or a promise that future mining revenue will match a past period.
Electrical and computational records answer different questions
A site’s electrical meter includes the loads within its measurement boundary. A miner’s specification may describe only that device, while facility readings can include cooling, distribution losses and support equipment. Therefore, a fleet count multiplied by nominal watts may not equal the site’s metered consumption. For efficiency analysis, record where power is measured and whether hashrate comes from local firmware or a pool. Comparing like boundaries is necessary before explaining a difference as inefficiency.
A practical reconciliation follows the same interval across device logs, electrical readings and pool reports. Check missing observations, rejected shares and planned interruptions, then calculate using consistent units. Energy in kWh accumulates over time; power in kW describes a rate. A monthly production total does not disclose a specific electricity tariff or a net margin. Our interpretation keeps those accounting and engineering questions separate rather than inventing information the September release does not provide.
The next useful confirmation
The next reporting cycle should be evaluated on the basis of whatever metrics are actually disclosed. A change to quarterly reporting does not itself prove a deterioration or improvement in mining performance. It does mean readers should check whether the definitions and coverage remain comparable. New financial statements, project milestones and operating disclosures can answer different questions, so preserve their individual dates instead of treating every company announcement as a mining-production update.
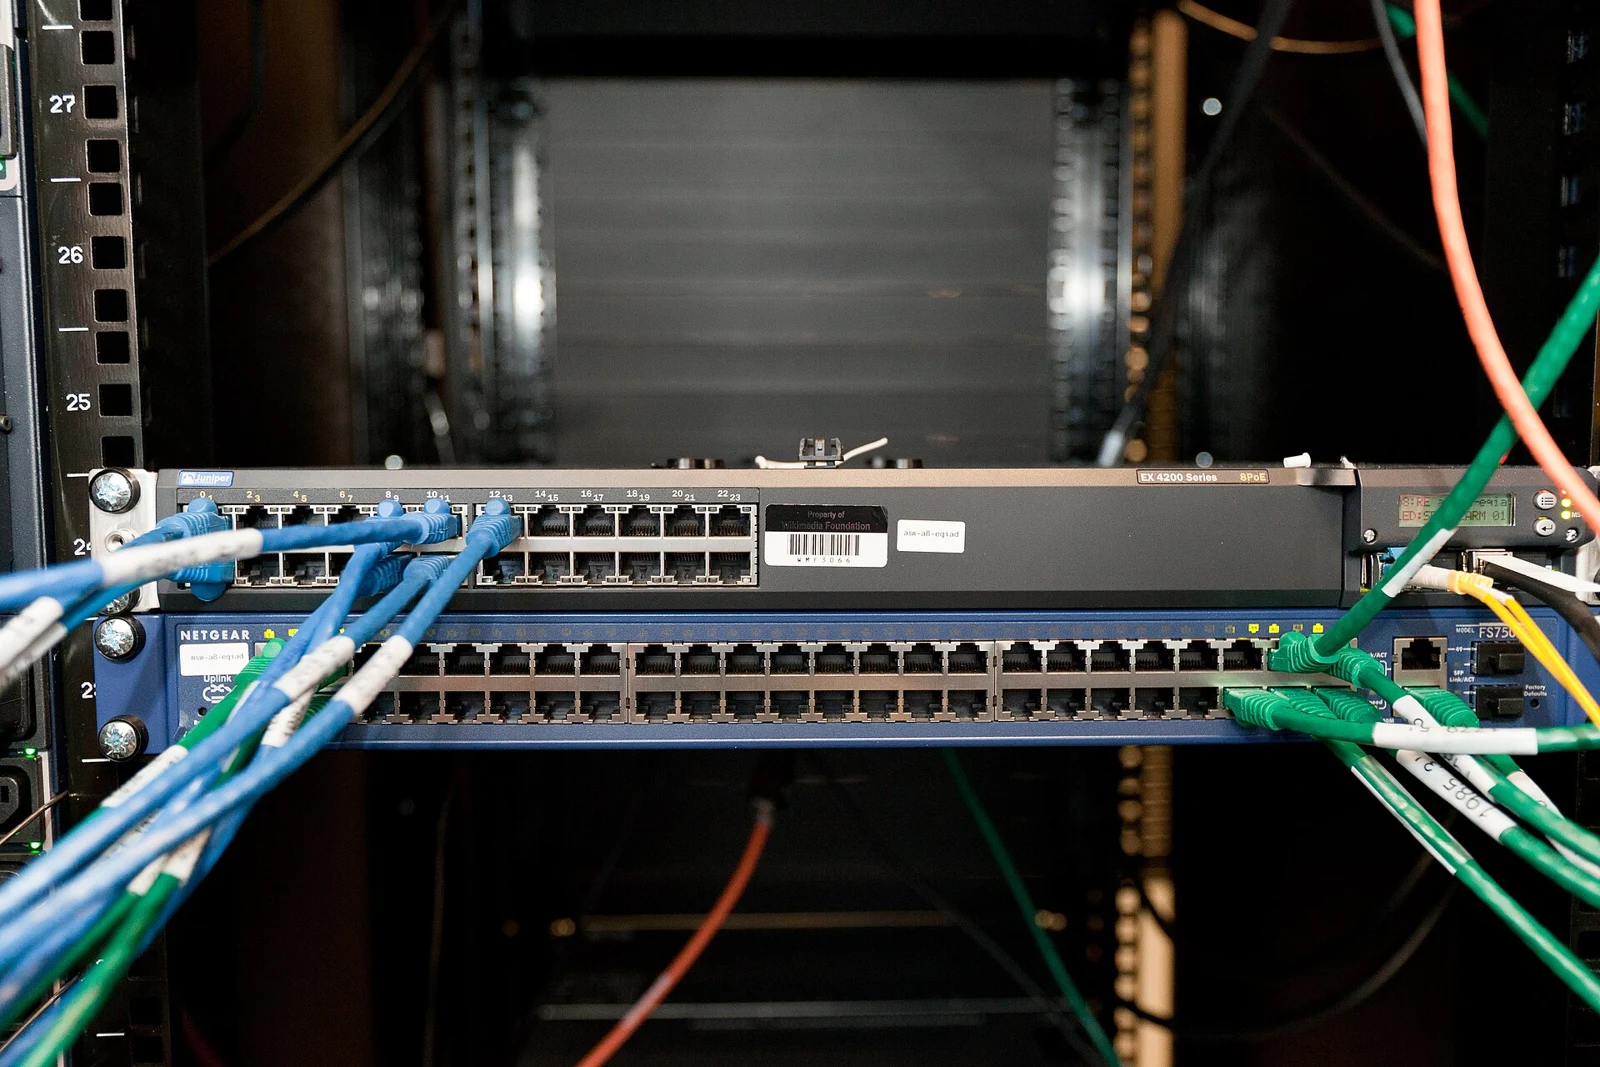
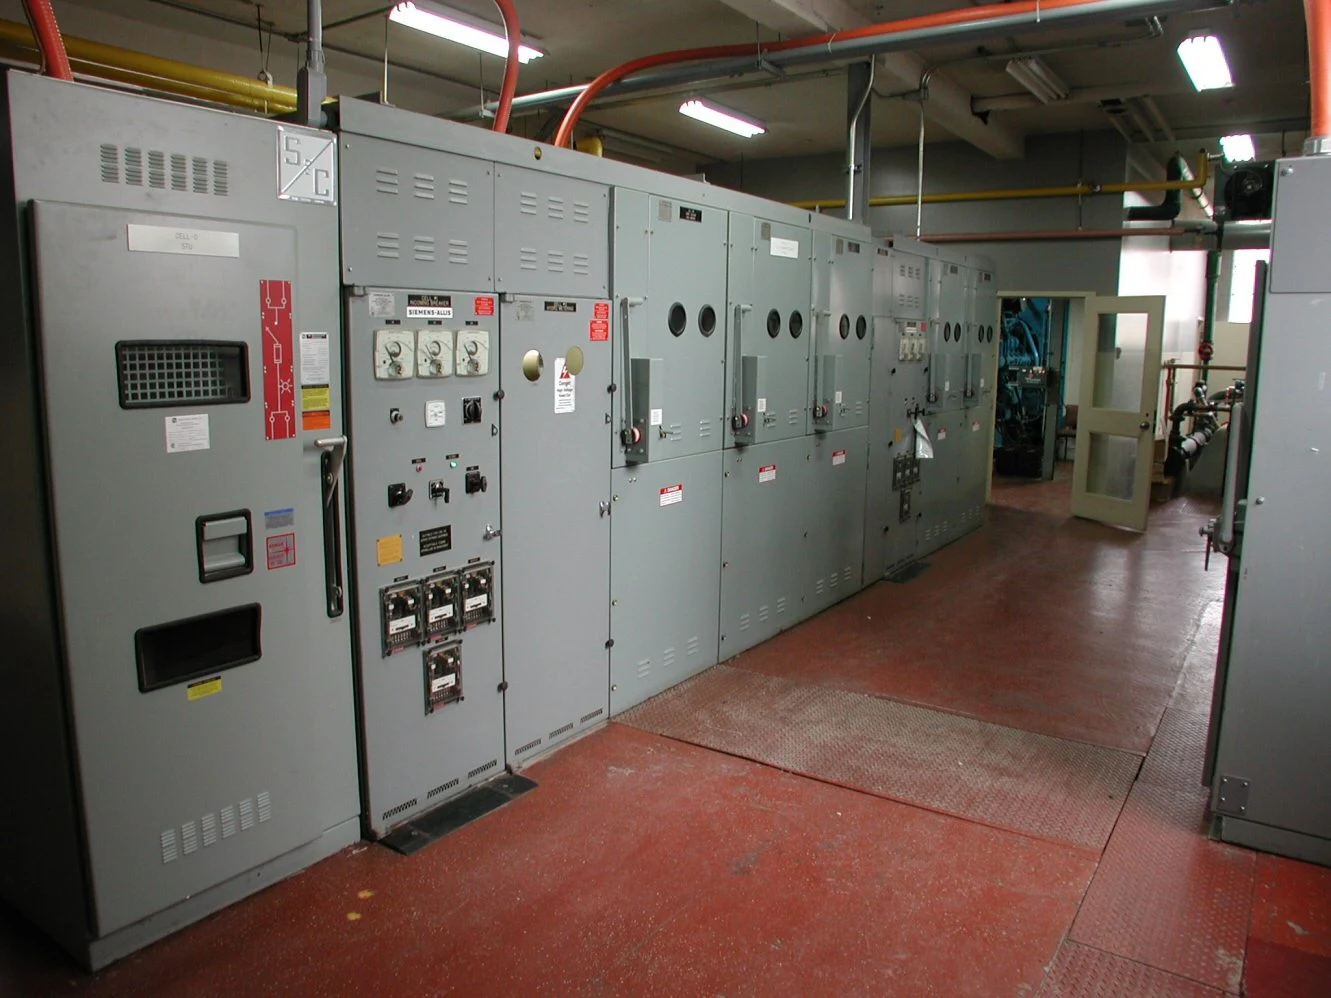
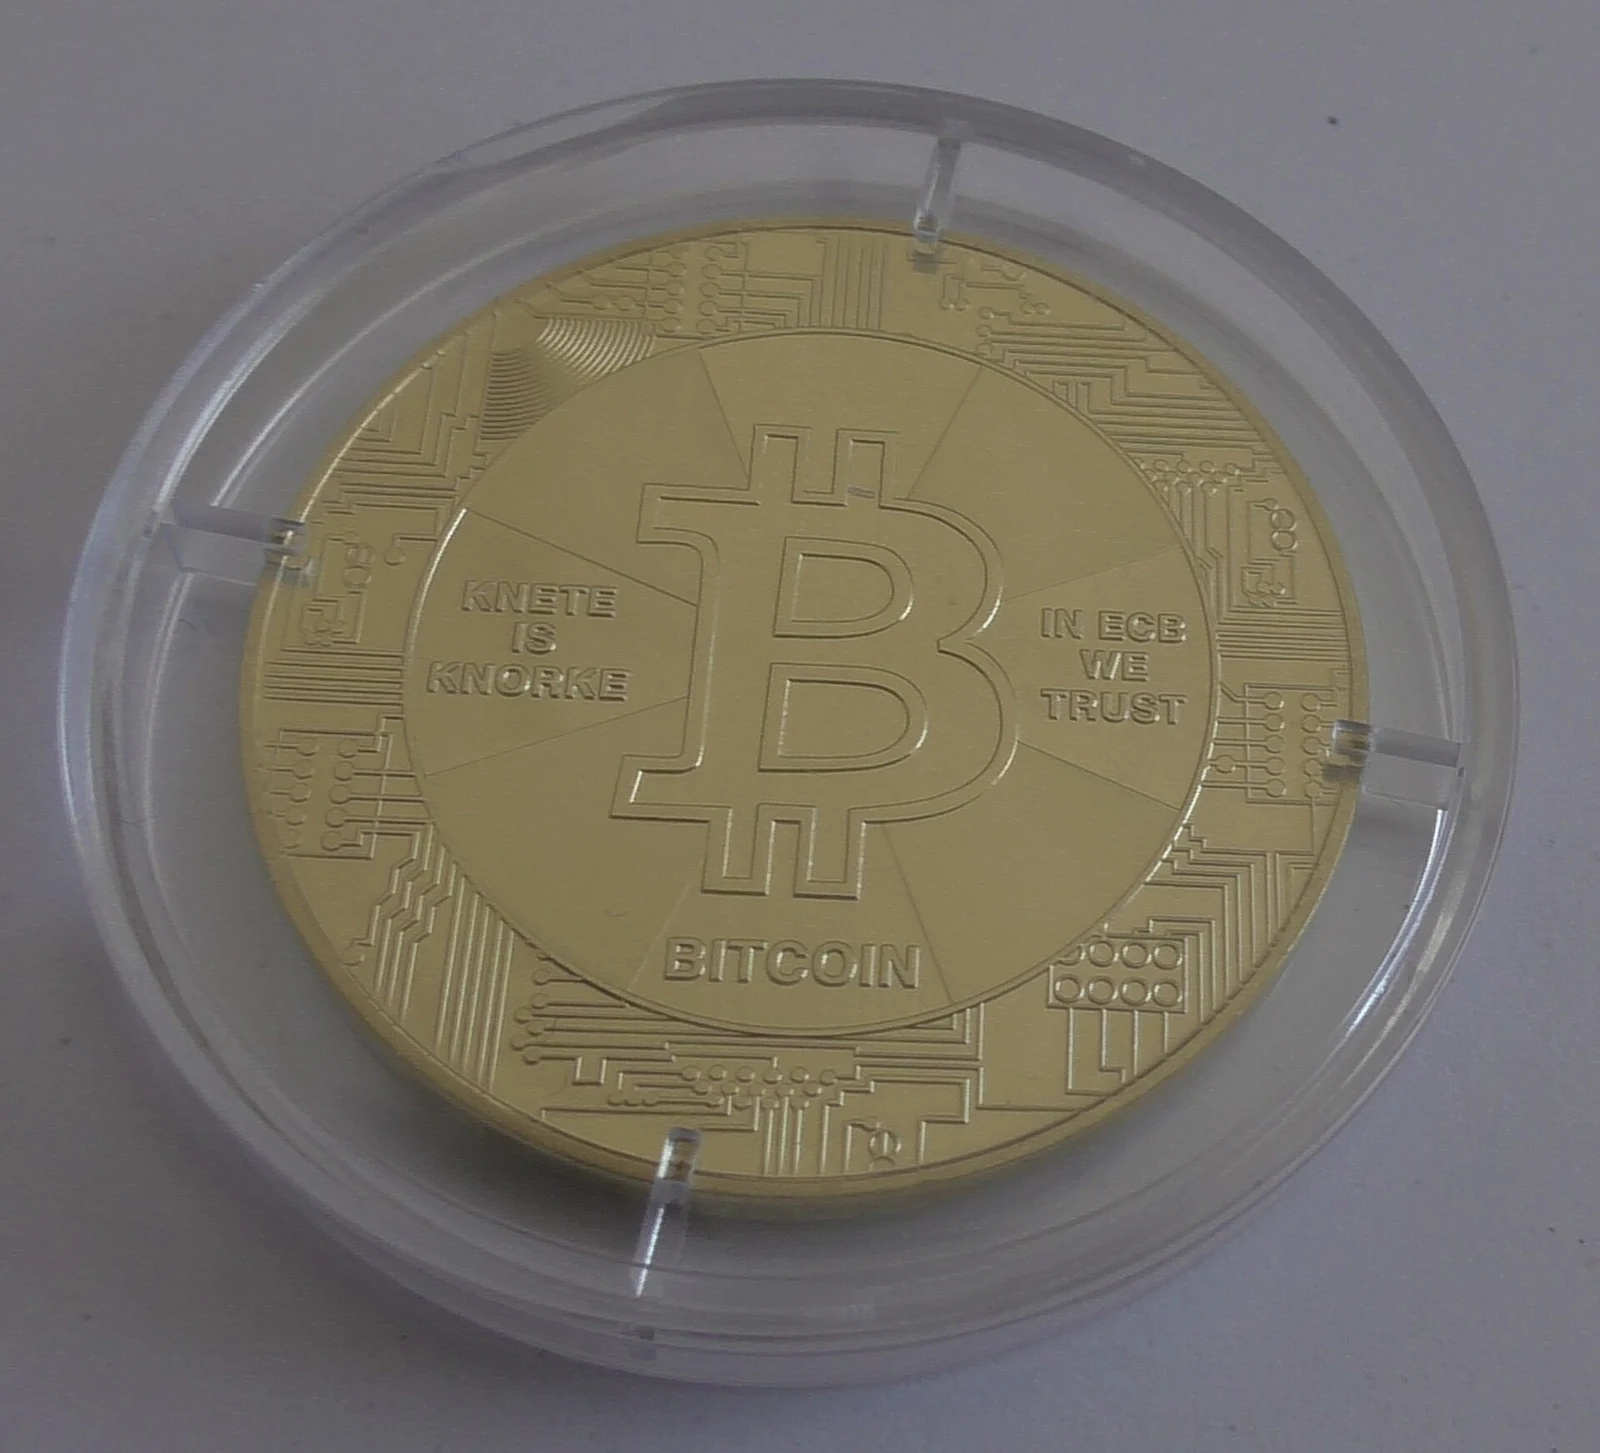
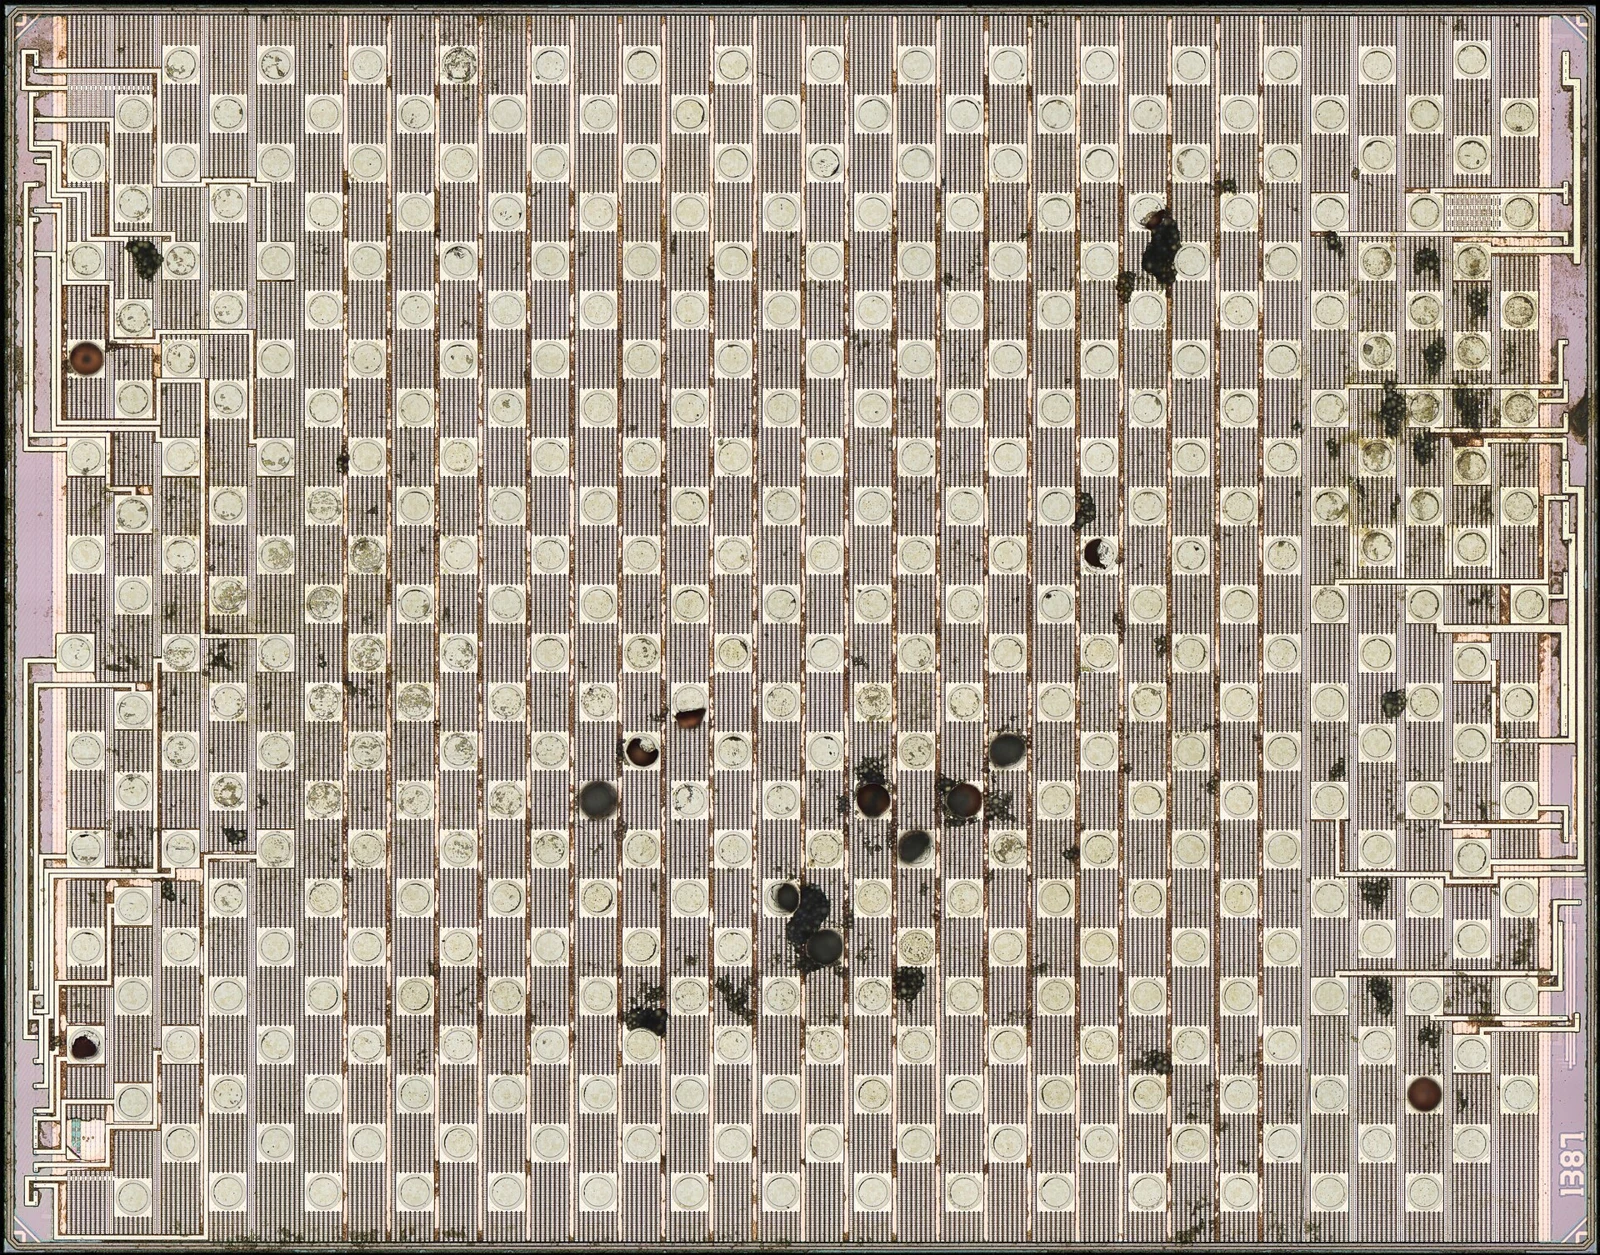
The accompanying licensed archival photographs illustrate an ASIC chip and computing infrastructure; they do not show CleanSpark’s September fleet. Readers can follow the dated original release through the source link and keep their own mining records in the calculator and farm tools. The useful result of this update is a clearly defined September observation and notice of a reporting change. Further conclusions about device models, downtime causes or future profitability require additional evidence.
Source: CleanSpark ↗
Mining calculator ↗