JPMorgan estimate puts Bitcoin production cost near $85,000 after 280-day squeeze
Source report: 2026-09-24 · Editorial analysis published: 2026-09-26
JPMorgan analysts estimated Bitcoin production cost around $85,000 and said price had moved above it after 280 days below, according to The Block. The figure is a model estimate rather than a universal miner break-even; actual costs vary sharply by power, fleet, financing and curtailment.
Analysis and practical implications
This section is our analysis and illustrative calculations, separate from the source report.
What the analysts estimated
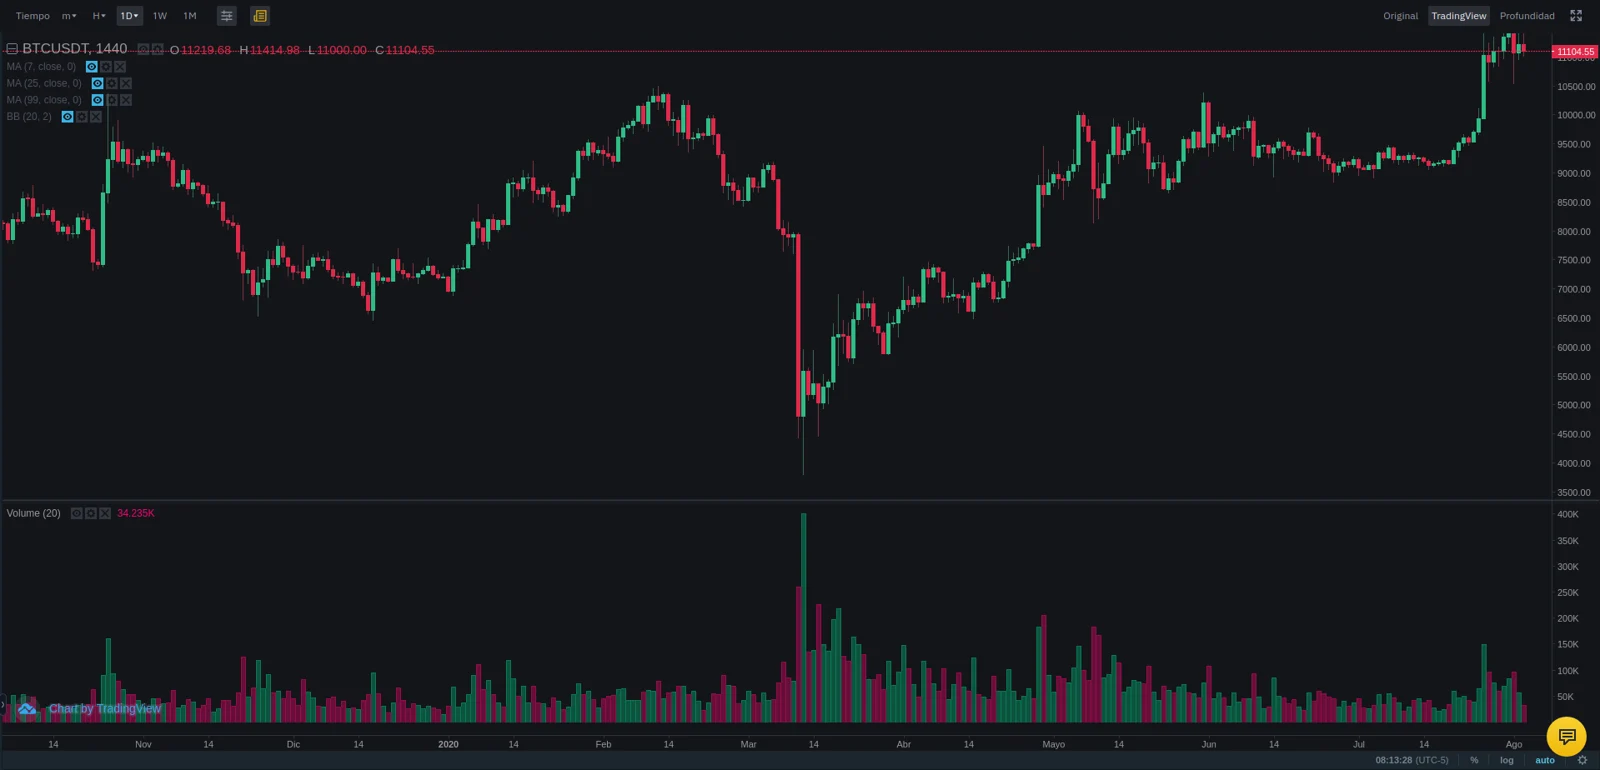
The Block reported on September 24 that JPMorgan analysts placed an estimated Bitcoin production cost near $85,000. They said market price had moved above that level after spending 280 days below it, which could reduce the risk of forced selling if the relationship persists. By the article’s publication, Bitcoin had slipped to roughly $84,100, illustrating how quickly a narrow margin can disappear. The estimate is an analytical indicator attributed to JPMorgan, not a value calculated or audited by the Bitcoin network.
Why $85,000 is not a universal break-even
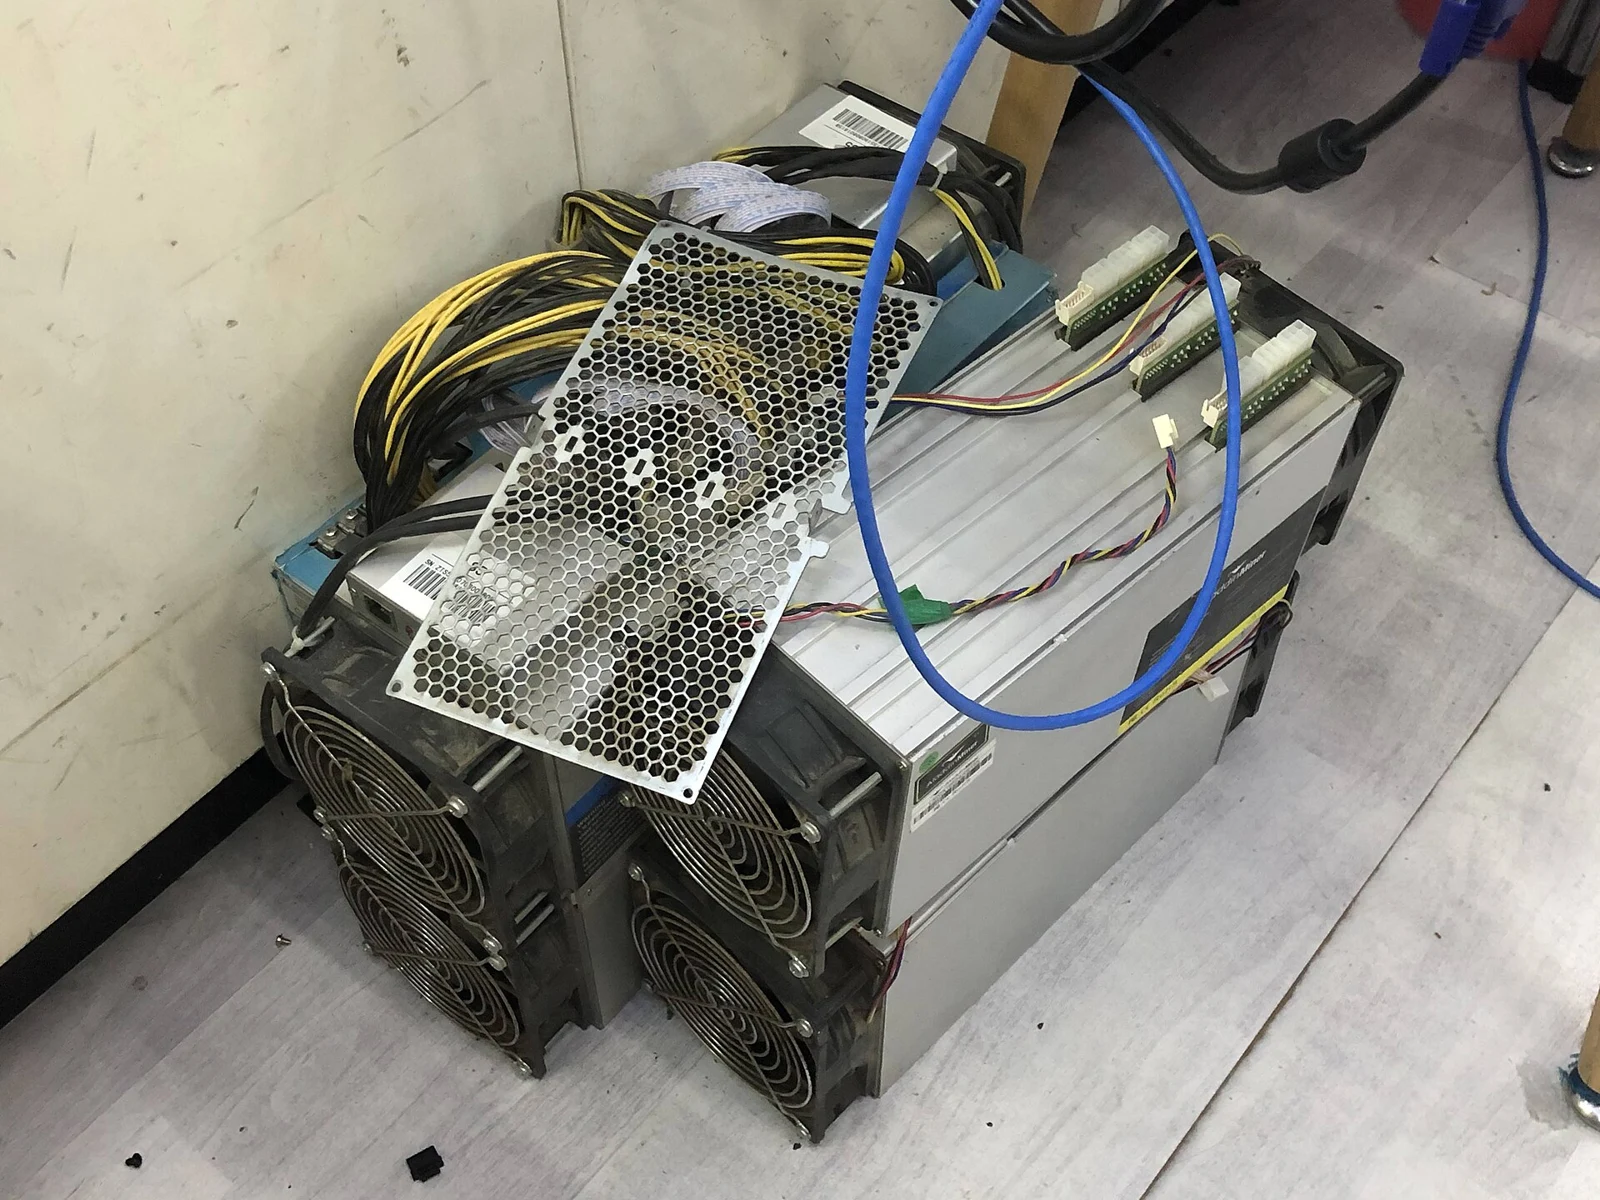
No single production cost applies to every miner. Electricity tariffs, demand charges, machine efficiency, cooling, labor, hosting fees, financing, depreciation, pool fees, curtailment revenue and tax treatment differ widely. A fleet of recent ASICs on curtailed or behind-the-meter power may remain cash-positive where older hardware on retail electricity does not. JPMorgan’s figure can serve as a market-level reference, but an operator must calculate marginal cash cost, fully loaded accounting cost and debt service separately for each site.
The 280-day comparison
The analysts described 280 days with price below their estimated production cost and compared the stretch with roughly 224 days in 2018. Duration can show how long pressure has persisted, yet the two periods differ in reward level, ASIC efficiency, energy markets, fees, derivatives and the industry’s capital structure. A historical “soft floor” is an observed relationship, not a guaranteed support level. Price can trade below modeled cost while miners consume reserves, hedge output, refinance or shut equipment down gradually.
How miners respond to pressure
The report said operators respond by moving to cheaper power, selling, idling or recycling inefficient machines. Each choice has a different threshold. Relocation adds freight, duties, setup time and counterparty risk; shutdown saves variable power but not rent and debt; equipment sales realize a price that may fall during industry stress. Before acting, miners should rank machines by joules per terahash and contribution margin, then model restart costs and contract obligations instead of applying one fleet-wide decision.
Hashrate and difficulty signals
According to the cited JPMorgan analysis, network hashrate was about 19% below its previous October peak and mining difficulty was around 15% lower. These figures describe the analysts’ observation date and can change at every difficulty adjustment or with new capacity. Falling difficulty can improve coin output for remaining hashrate, but it does not guarantee profit if Bitcoin price, fees or uptime deteriorate faster. Operators should use current on-chain values and their pool statistics rather than treating article percentages as live readings.
Competition for powered sites from AI
The analysts also pointed to AI companies paying premiums for powered data centers. A grid connection, transformer, land, fiber and cooling path can be valuable before servers are installed, so some miners compare Bitcoin cash flow with conversion, lease or sale to AI users. The alternatives are not identical: AI generally needs different redundancy, networking, buildings, staffing and service-level commitments. A quoted premium must be reduced by conversion cost, delivery time, financing and the probability that the customer actually reaches operation.
Public, private and sovereign capacity
The report said public mining companies were slowing hashrate growth while private and sovereign-backed operators gained share. That is a directional analyst claim, not a complete census, because private facilities disclose less and pools do not map cleanly to beneficial ownership. Listed companies publish fleets, contracts and capital spending more often, which can make their retreat easier to observe. Any market-share conclusion should state its data set, date and attribution and should not treat unidentified hashrate as automatically private or state-controlled.
Operator metrics that matter now
For an operator, the most useful dashboard combines realized hashprice, wall power, all-in electricity, uptime, rejected shares, cooling load, debt maturities and liquid reserves. Run scenarios above and below $85,000 rather than using it as a shutdown switch. Track the next difficulty adjustment, transaction-fee share, hashrate recovery and evidence of machine sales or site conversions. If price stays only slightly above a model estimate, hedging and cash discipline may matter more than the headline crossing itself.
Source: The Block ↗
Mining calculator ↗