IEA September data update shows solar supplied a record 22.5% of OECD Europe electricity in June
Source report: 2026-09-16 · Editorial analysis published: 2026-09-28
The IEA’s September 16 monthly update reports 285.1 TWh of net generation in OECD Europe during June 2026. Solar produced 64.0 TWh, or a record 22.5% share, while Spain, Türkiye and France recorded the largest absolute year-on-year increases.
Analysis and practical implications
This section is our analysis and illustrative calculations, separate from the source report.
The September update records a new solar share
The International Energy Agency updated its monthly electricity statistics on September 16, 2026. Its highlighted June data show OECD Europe produced 285.1 TWh of net electricity, 3.4% more than a year earlier. Solar generation reached 64.0 TWh and represented 22.5% of the total, a record share. The figures describe a regional monthly balance, not the electricity mix at a particular mining site. Operators should use local settlement and grid data before assigning a renewable share to their own ASIC output.
Solar delivered the largest year-on-year increase
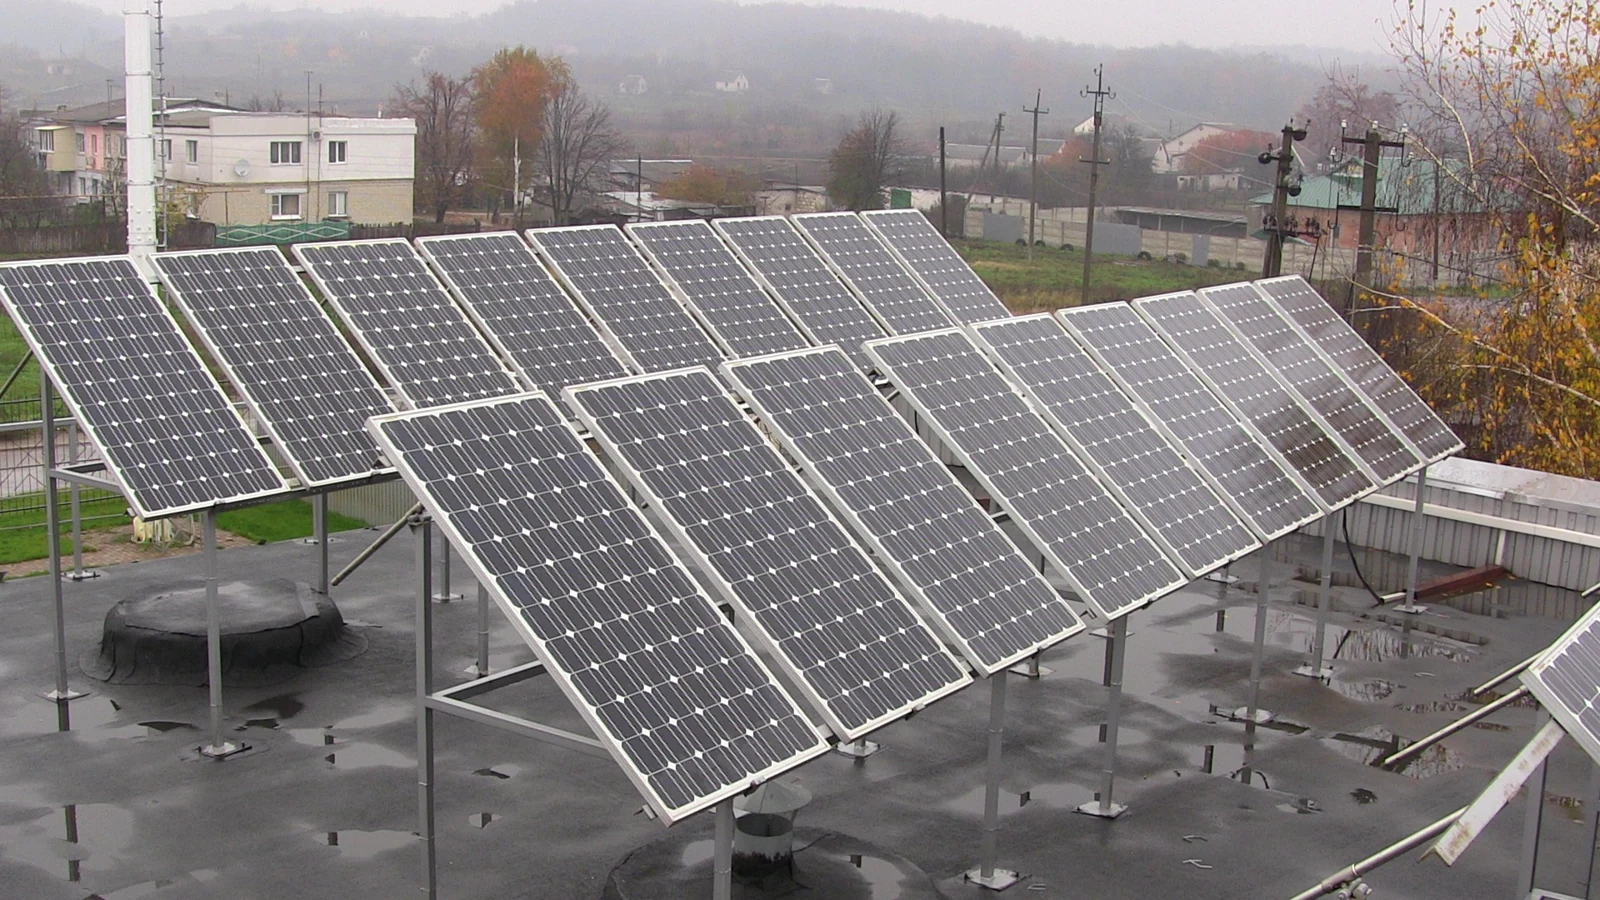
The IEA says solar generation in OECD Europe rose 13.5% year on year, adding 7.6 TWh. Spain added 1.5 TWh, Türkiye 1.1 TWh and France 1.1 TWh, the three largest absolute increases listed in the update. This growth can create low-price daytime intervals where supply is abundant, but it does not guarantee cheap power everywhere. Transmission limits, negative-price rules, curtailment, taxes and retail contracts determine whether a mining facility can actually capture the system-level change.
A monthly average hides the hourly opportunity
Mining economics respond to the price and availability of electricity each hour, while a monthly generation share blends sunny afternoons with nights, cloudy periods and network constraints. A 22.5% solar share can coexist with high evening prices and local congestion. Farms considering flexible operation should obtain nodal or zonal prices, compare them with production schedules and measure how often their connection experiences usable low-cost windows. Annual certificates or regional averages cannot replace the meter and invoice at the delivery point.
Flexible mining can follow surplus intervals
ASIC loads can reduce consumption quickly and resume when prices or grid conditions improve, which makes them different from many continuous industrial processes. Greater solar output can expand the value of scheduling miners around low-price periods, especially for less efficient hardware. The operator still needs a revenue threshold that includes hashprice, pool fees, restart losses and equipment wear. Curtailment should be based on the marginal cost actually avoided, not on the headline share of renewable generation.
Location matters as much as generation volume
Spain, Türkiye and France led the absolute increase, yet each market has different grid rules, interconnection queues, taxes and treatment of large flexible loads. A project cannot assume that a regional trend transfers directly across borders. Due diligence should include local power purchase terms, network charges, balancing exposure, curtailment compensation, permits and the ability to participate in demand-response programmes. The same ASIC fleet can have very different profitability under two contracts connected to the same national system.
Heat and cooling can offset cheap daytime energy
Solar peaks often coincide with hot weather, when air-cooled miners consume more auxiliary power and may throttle. A low wholesale price is valuable only if the site can deliver safe inlet temperatures without spending the saving on cooling. Operators should compare total facility power, not nameplate ASIC power, and track power usage effectiveness by hour. Hydro or immersion systems have different pump and heat-rejection limits. Price-responsive dispatch should include thermal capacity so it does not command a profile the building cannot sustain.
Record generation is not proof of additionality
A miner using grid electricity during a high-solar month may help absorb supply, but that alone does not prove the project caused new renewable capacity to be built. Claims about additionality require contracts, financing or traceable procurement linked to new generation. Claims about emissions also depend on the marginal generator at the time of consumption. Operators should distinguish the regional mix, contractual renewable attributes and real-time marginal impact instead of using the record 22.5% figure as a blanket environmental label.
The IEA data are useful for planning scenarios
Monthly series help planners observe seasonality, compare countries and test whether expected low-price windows are becoming more frequent. They are best combined with hourly market prices, site load, weather and pool revenue. A mining model can run scenarios for full operation, efficiency profiles and curtailment under the same historical intervals. The result should report energy consumed, BTC earned, gross margin and missed production separately, allowing managers to see whether flexibility added value rather than merely reducing electricity use.
What miners should take from the update
The September release confirms that European solar generation reached a material scale in June: 64.0 TWh and 22.5% of OECD Europe’s net output. For miners, the opportunity lies in matching controllable load to local low-cost hours while respecting thermal and contractual limits. The data support closer study of price-responsive operation; they do not establish a universal European electricity price or a site-specific carbon claim. Local meter, tariff and dispatch records remain the final evidence.
Source: International Energy Agency ↗
Mining calculator ↗