Bitcoin mining earned more in BTC and less in dollars in November 15 estimates
Source checked: 2026-11-16 · Editorial analysis published: 2026-11-16
The completed UTC day put expected gross revenue at $30.31 per PH/s. The same dataset shows why a better coin estimate can still leave less for electricity.
Two different readings from the same day
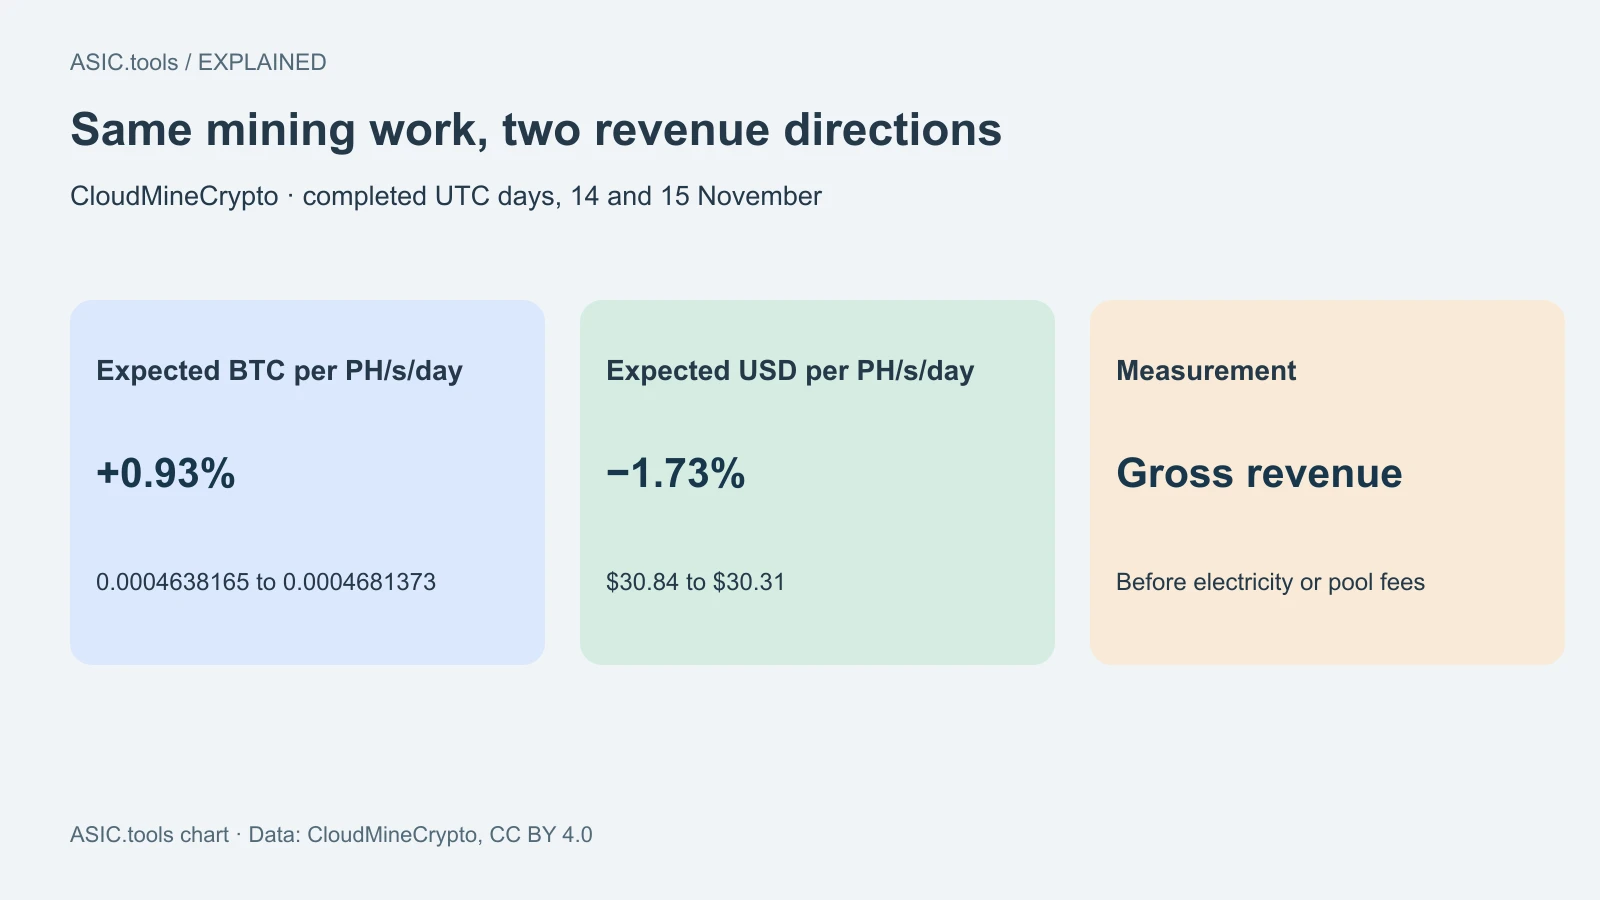
The completed November 15 UTC record in CloudMineCrypto’s daily dataset shows a change that a Bitcoin miner can feel at the power meter. Expected gross revenue from one petahash per second running for a day rose to 0.0004681373 BTC, from 0.0004638165 BTC the day before. In dollars the same benchmark slipped from $30.84 to $30.31. An operator paying a bill in cash cannot use the change in coin earnings alone to judge whether the operation covers that bill. Compared with November 14, that is about 0.93% more BTC and 1.73% fewer dollars per unit of work.
The indicator is called hashprice. It estimates what a standard amount of mining power could earn before costs. CloudMineCrypto calculates it from the subsidy, fees and difficulty of the blocks in each UTC day, then converts the result to dollars. A full day’s result and an intraday tick are different comparisons. The figures here use two completed days in the same dataset, checked on November 16.
The amount that reaches a small machine
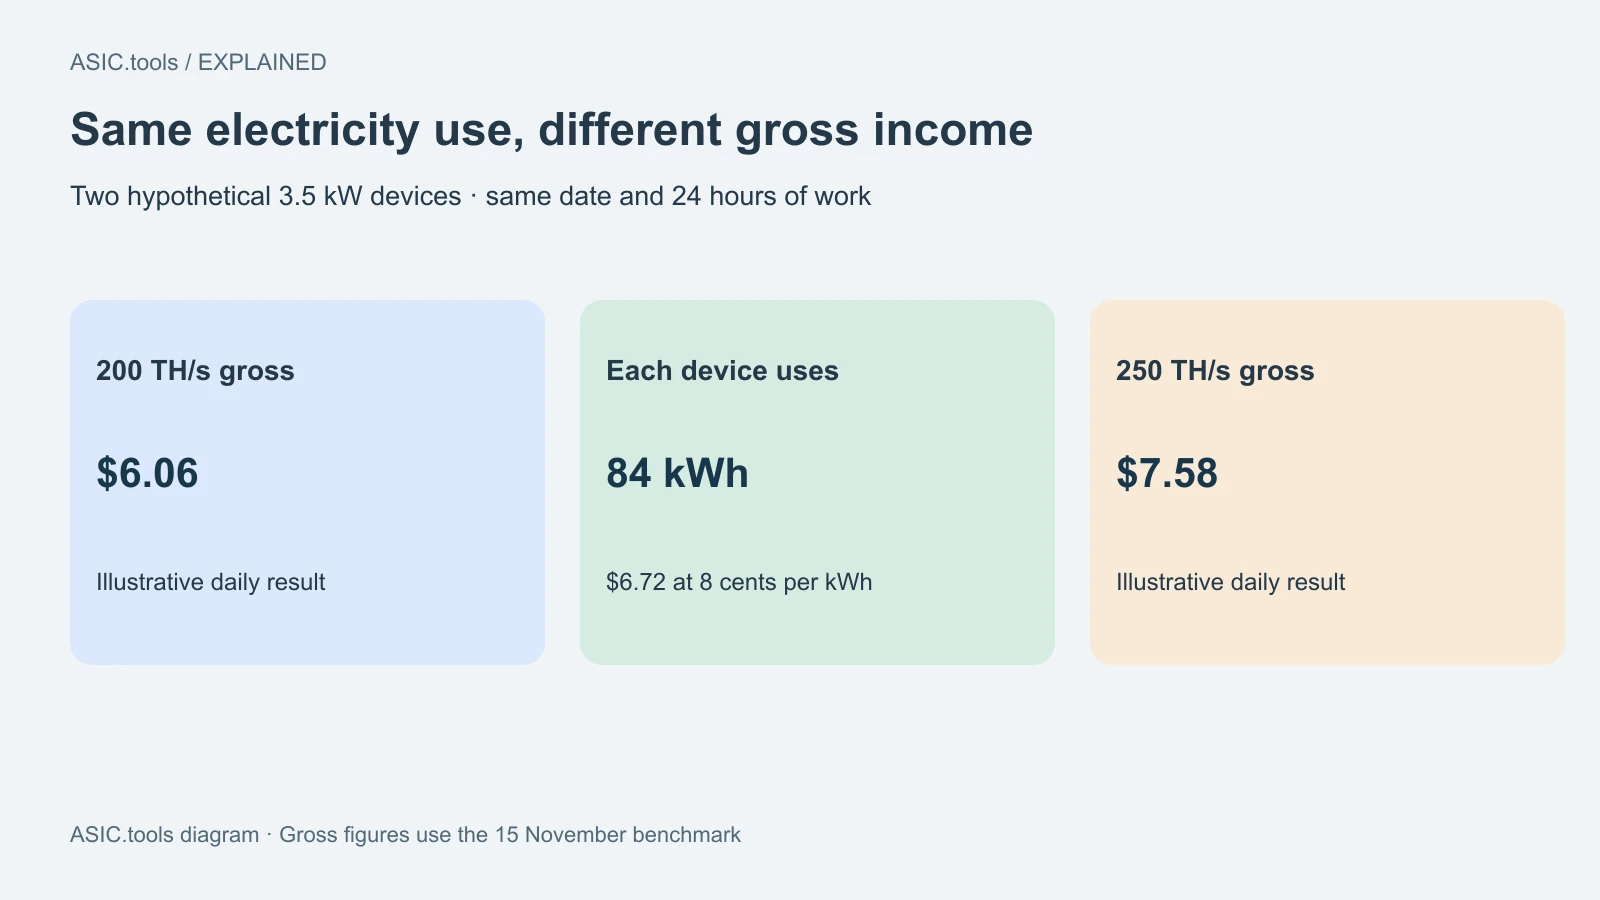
One PH/s is one thousand TH/s, so a 200 TH/s device represents 0.20 PH/s. At the November 15 daily benchmark, it would yield about $6.06 in gross revenue if it ran for the whole day. A 250 TH/s device would yield about $7.58. These are illustrative machines with assumed steady hashrate, before pool fees or downtime. Real payouts can differ because each pool has its own method and each miner has its own accepted work.
Dollar revenue answers a useful question when your electricity bill is in dollars or another national currency. A miner who keeps the coins can instead track the amount of BTC received and use the local exchange value for its running budget. Keeping those figures separate prevents a higher estimate in coins from hiding a lower budget for power.
How the electricity bill changes the result
Take two hypothetical machines that each draw 3.5 kW at the wall. Each uses 84 kWh over a full day. At an illustrative tariff of $0.08 per kWh, the bill is $6.72 per machine. The 200 TH/s example falls below electricity cost. The 250 TH/s example leaves about $0.86 before pool fees, cooling, hosting, repairs and hardware costs. The two examples pay the same electric bill but bring in different revenue.
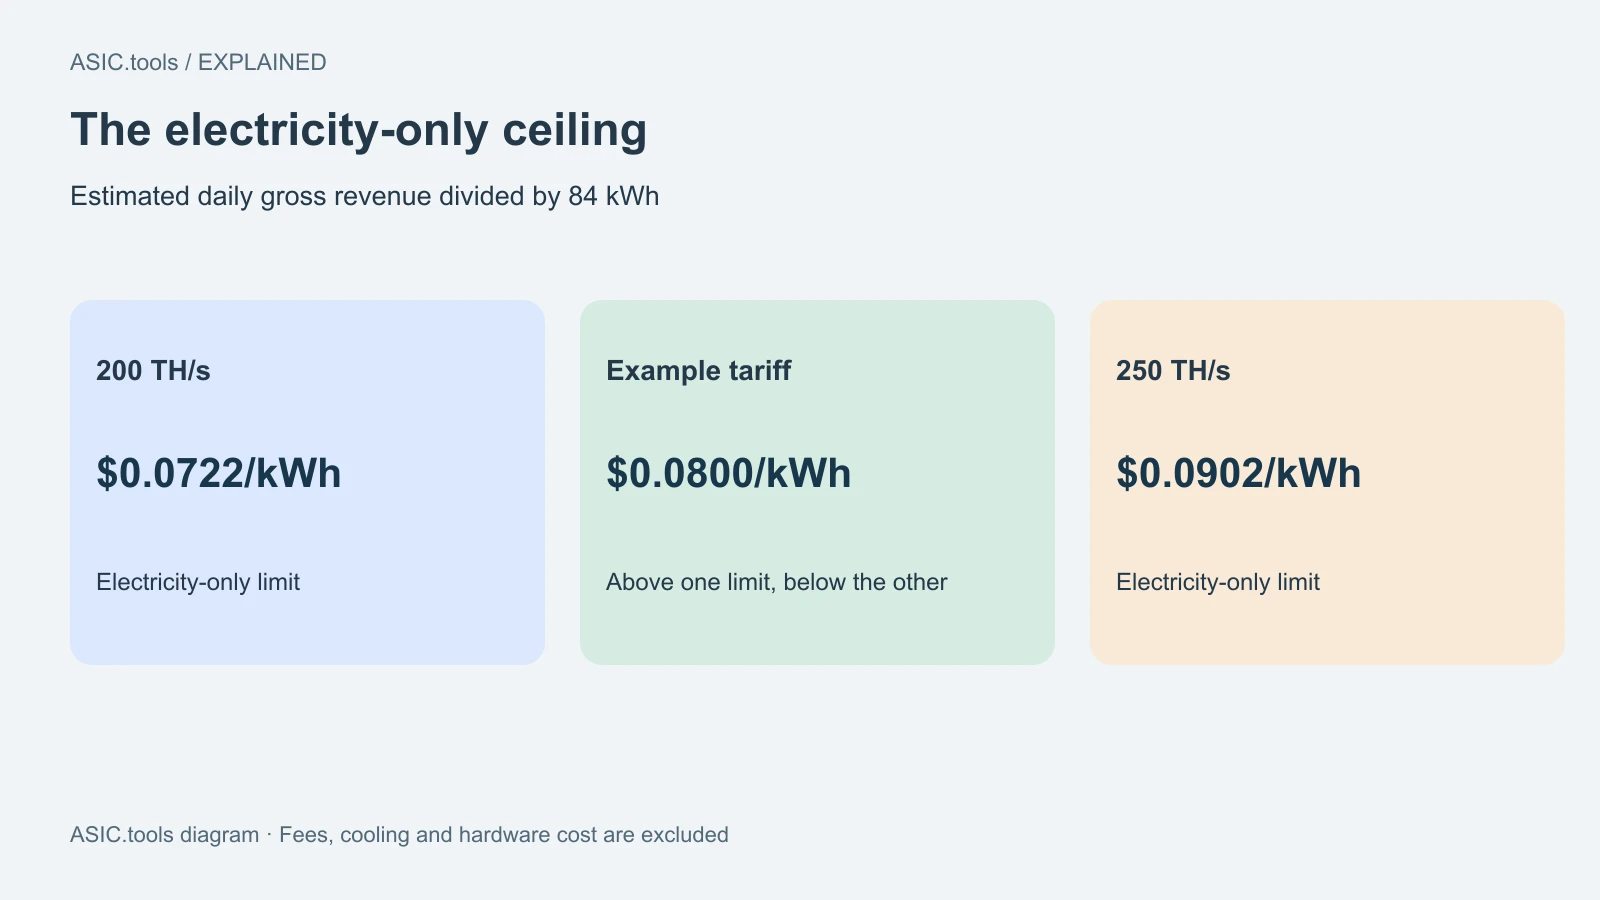
Dividing estimated gross dollars by those 84 kWh gives an electricity-only ceiling of about $0.0722/kWh for the slower example and $0.0902/kWh for the faster one. That is the tariff at which the estimate and the electric bill meet. It is lower in practice after fees and other costs. When actual wall power or uptime differs, substitute the measured values.
Get the numbers from the same period
For a useful daily comparison, read pool credit and electricity usage over the same window. If the rig switches off during the day, use the power meter for the whole window and the pool’s accepted work for those same hours. Add any site costs that do not disappear when the device stops. This helps avoid treating a short period of stable output as a full day of revenue.
The weekend readings show why difficulty, coins earned and the cash bill belong in the same comparison. A machine can be producing more expected BTC for its work while facing a lower dollar allowance for the same hours. Let the dated benchmark guide the estimate and use the meter and pool statement to see what actually happened.
Source: CloudMineCrypto ↗ · Daily dataset, CSV ↗ · Luxor Hashrate Index methodology ↗
Mining calculator ↗