Aterio’s October report separates gigawatt plans from data-center construction
Source report: 2026-10-08 · Editorial analysis published: 2026-10-09
Aterio’s October 8 update reviews September projects in the United States. Campus plans, generation capacity and visible construction need separate treatment when assessing infrastructure demand.
Analysis and practical implications
This section is our analysis and illustrative calculations, separate from the source report.
A new report about September activity
Aterio released its October 2026 US Datacenter Monthly update on October 8, reviewing development activity observed during September. The company’s own announcement, distributed through EIN Presswire, is the source for the project figures in this article. Its dataset includes operating, under-construction and announced projects, so the report is a development pipeline overview rather than a measurement of electricity already consumed. For mining operators, the useful signal is how competing infrastructure is progressing toward power access, not simply the largest number in a headline.
The report deserves to be read with its timing intact: publication in October does not make all the underlying project milestones October events. Nor does a tracked proposal necessarily create a new operational customer for an energy supplier. Our analysis distinguishes the evidence needed at each stage and explains how a mining business can use such information when assessing a region. We have not independently certified every permit, customer contract or engineering assumption in Aterio’s commercial dataset.
Homer City illustrates the difference between loads
Aterio describes Amazon’s Homer City campus in Pennsylvania as 39 planned buildings across six sites, with about 3.7 GW allocated to data centers from a 4.5 GW power plant. It lists phased completion from 2030 through 2036. These are reported project plans, not new capacity available to miners today. The plant rating and campus allocation describe different things and must not be added together as though the announcement created 8.2 GW of computing capacity.
For a mining operator evaluating a neighboring location, proximity to a proposed power project does not establish a right to buy its output. Physical connection, delivery arrangements, tariffs and construction timing are separate questions. A large campus might need dedicated equipment while another customer uses a different substation or supplier. An actionable site comparison therefore starts with the power actually offered to your facility, its contractual delivery date and its limitations, rather than assuming that a regional headline guarantees cheap available electricity.
Construction evidence is a different milestone
The update says satellite imagery shows site clearing at Fluidstack’s planned Harlingen campus in Texas, which is described as up to 1.5 GW. Clearing is evidence of physical activity, but it is not equivalent to an energized data hall. A project can advance in one workstream while electrical procurement, cooling installation or commissioning remains incomplete. Even when the eventual campus scale is substantial, the initial phase may have a different load and schedule from the full development.
Our reading is that a staged timeline is more useful than a binary label such as “announced” or “live.” Land preparation, foundations, installed electrical equipment, utility connection and customer acceptance answer different questions. A mining project should be evaluated the same way: an attractive hosting presentation is only the beginning. Before relying on a promised start date, request the milestone that determines when your equipment can actually be powered, tested and brought into service under the agreed operating conditions.
A concept can remain blocked despite its scale
Aterio also identifies the proposed Peosta Energy and Data Campus in Iowa as concept-stage amid city and county moratoria, with a stated 500–850 MW onsite gas-generation proposal. That range is a reported proposal, not proof that a plant has been approved or built. Separating this example from the Texas clearing update prevents a misleading comparison between facilities at very different stages. A moratorium is a project-status issue in this account; our article does not interpret the underlying local ordinances as legal advice.
The general lesson for operators is that economic and permitting readiness are independent. A customer commitment can support financing without removing a construction restriction; available land can coexist with a long electrical queue. When a hosting offer relies on future infrastructure, note the unresolved dependencies explicitly. The best-case date and the earliest firm contractual delivery date may differ. Keeping both in a planning model makes delays visible before they turn into idle equipment, storage costs or a sudden need to move machines elsewhere.
Keep electrical power and annual energy separate
The project numbers above are stated in watts of capacity. They are not a count of machines, a measured average load or annual electricity use. For illustration, a hypothetical facility drawing a steady 10 MW for 24 hours consumes 240 MWh in that day. At a hypothetical 90% average utilization across a 365-day year, the same 10 MW limit corresponds to 78,840 MWh, or 78.84 GWh. These calculations explain units; they are not forecasts for any Aterio project.
A mining profitability calculation needs the actual machine load, cooling and distribution overhead, operating hours and tariff. Nameplate capacity can be a ceiling rather than an average. Curtailment, staged commissioning and maintenance change annual energy use even if the electrical connection rating stays fixed. A model that treats every announced megawatt as a full year of nonstop consumption can therefore overstate demand and misrepresent both the site’s economics and the amount of generation required to serve it.
Dedicated generation still has operating costs
Behind-the-meter generation describes an electrical arrangement, not a guarantee of free energy. A dedicated plant still has fuel, maintenance, availability and capital costs. Its design may also need redundancy and procedures for switching between operating states. Those questions matter to an AI customer with a continuous service requirement and to a miner that can choose to stop hashing when the marginal electricity cost becomes unfavorable. The business cases differ even if both are expressed in megawatts.
For an ASIC farm, a useful scenario compares gross mining income per operating hour with the incremental cost of keeping the fleet on. A separate scenario accounts for fixed costs that remain during curtailment, such as hosting commitments or financed equipment. This does not require adopting an AI campus’s revenue assumptions. Instead, it prevents a common error: copying the apparent scale or financing of a data-center project into a mining model without checking the workload, service obligations and ability to tolerate interruptions.
Assess each opportunity at the facility level
Our suggested facility checklist connects regional reports with a real operational decision. Establish which capacity is available to your load, whether the quoted limit refers to IT equipment or total site input, and which expenses are included in the hosting price. Then map the delivery schedule to the equipment’s commissioning and warranty requirements. A server campus figure cannot be converted directly into a number of ASICs without accounting for machine specifications and the facility’s electrical and thermal design.
The same principle applies when comparing an existing mining site with a possible conversion to other computing workloads. Space and power are necessary, but they do not demonstrate suitable network connectivity, redundancy, cooling or customer demand. A conversion cost estimate should identify which infrastructure can be reused and which must be replaced. Doing that facility-by-facility is more informative than concluding that every mining building benefits immediately because a national development report contains large future campus plans.
How to use the report without double counting
The three examples show why project status belongs next to project scale. Pennsylvania supplies a long-range phased plan, Texas supplies reported evidence of site preparation, and Iowa supplies a concept with unresolved local restrictions. The October report is useful as a starting point for deeper verification and regional monitoring. Its public announcement does not provide a standardized total of newly operational power, so we do not manufacture one by adding differently defined figures or mixing campus demand with generation capacity.
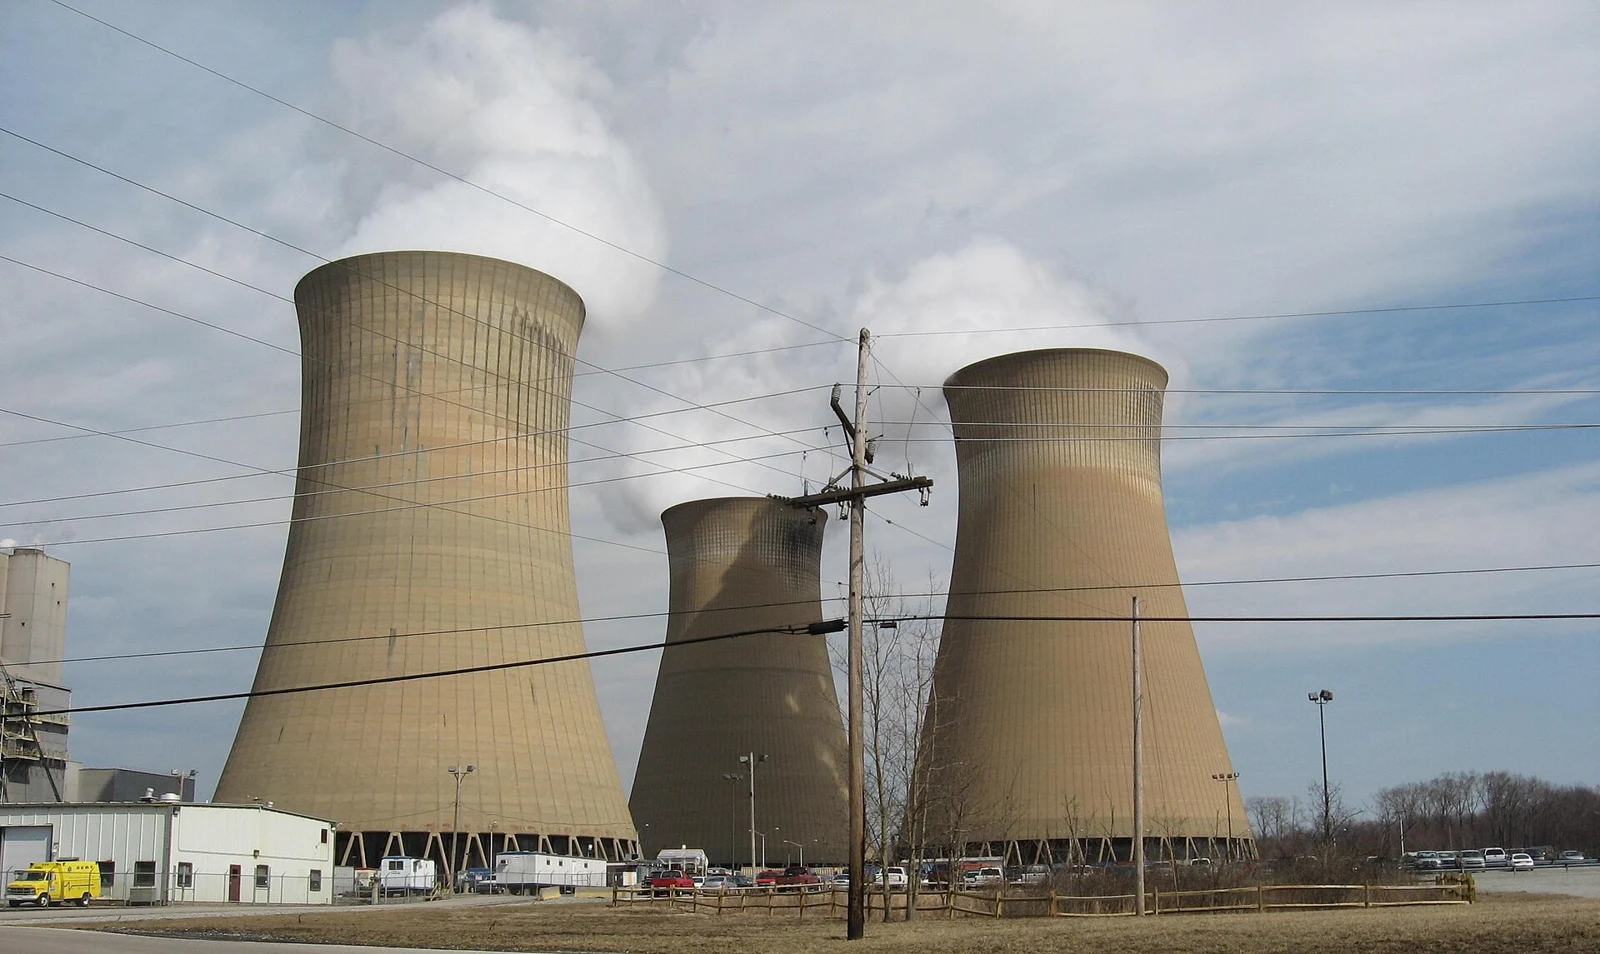
The photographs accompanying this article are licensed archival images used for context. They do not show the named projects’ October progress or establish current construction milestones. For a practical investment or hosting decision, follow the specific developer, utility and permitting authority as the next evidence sources. ASIC.tools’ central takeaway is a method of reading infrastructure news: preserve the source date, distinguish capacity from consumption and treat announced scale, visible work and delivered service as different facts.
Source: Aterio ↗
Mining calculator ↗