Mining week: 2026-08-31
Source report: 2026-08-31 · Editorial analysis published: 2026-09-10
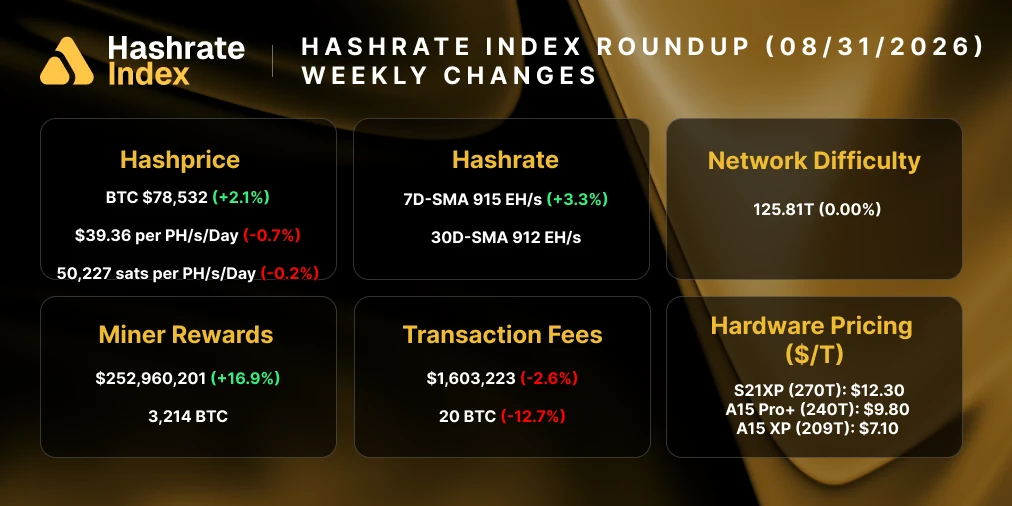
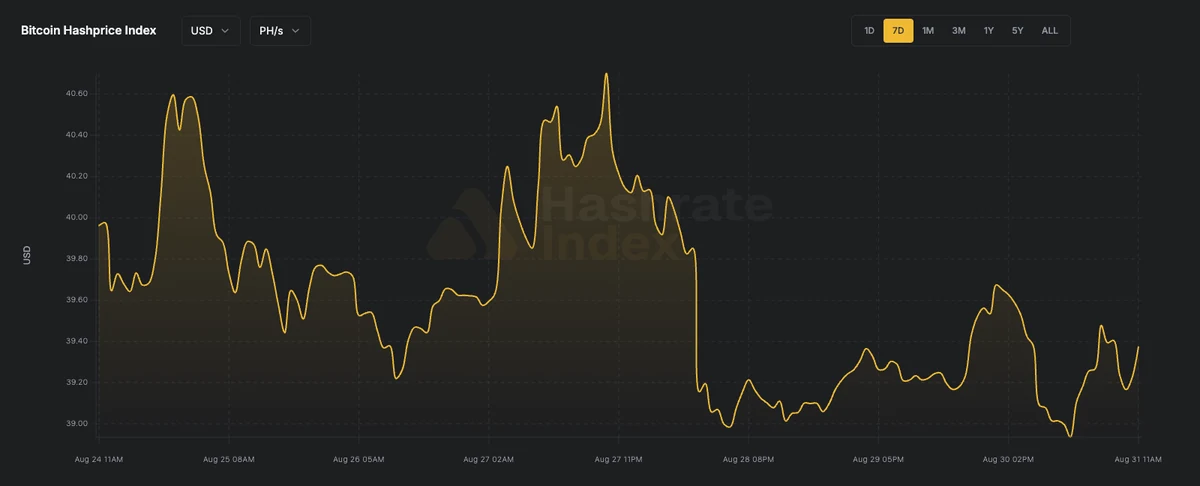
The weekly review records hashprice at $39.36 per PH/s/day (−0.7%). Figures describe the publication date, not today’s market.
Analysis and practical implications
This section is our analysis and illustrative calculations, separate from the source report.
A stronger market does not repair inefficient operation
The end-of-August review is a useful occasion to separate market improvement from operating quality. A fleet can receive more money while still losing avoidable production through unreliable machines or incomplete maintenance. Use the stronger interval to identify those problems rather than allowing increased receipts to conceal them.
The following calculation is an independent illustrative scenario using the dated market reference. It is not a reconstruction of a particular farm, a live quotation or a promise of future revenue. Its purpose is to make the relationship between output, energy and operating time easy to inspect.
A transparent daily operating scenario
Assume a machine produces 234 TH/s while drawing 3510 watts. At a gross hashprice of 39.36 dollars per PH/s per day, continuous gross revenue would be about 9.21 dollars. For this example, apply a 2% pool fee and 95% operating time. The resulting daily receipts are approximately 8.57 dollars before electricity and other expenses.
At the same 95% operating time, the machine consumes approximately 80.03 kWh per day. This assumes that both production and the stated miner load stop during downtime. Real standby consumption or auxiliary cooling can change the result and should be added when those measurements are available.
Compare three electricity conditions
Keeping all other assumptions unchanged, the scenario gives the following daily outcomes: at 0.04 dollars per kWh, electricity costs 3.20 dollars and the remaining contribution is 5.37 dollars; at 0.07 dollars per kWh, electricity costs 5.60 dollars and the remaining contribution is 2.97 dollars; at 0.10 dollars per kWh, electricity costs 8.00 dollars and the remaining contribution is 0.57 dollars. A negative contribution means that the modeled receipts do not cover the modeled electricity expense at that rate.
The calculation excludes purchase cost, financing, rent, taxes, repairs and shared site equipment. A positive number is therefore an operating contribution within the stated boundary, not final business profit. Use the actual bill and measured installation power when adapting the scenario to a real site.
What to record before the next review
Keep the source date with the market input and record the machine configuration used in the comparison. For actual operation, retain accepted pool work, operating hours, electricity consumption and unusual maintenance. This allows the next review to distinguish changes in market conditions from changes in the equipment or schedule.
The useful decision is the one supported by the complete operating record. A weekly observation can help test assumptions, but it should not replace a longer view of reliability and cost. Repeat the calculation with your own tariff and a less favorable revenue case before using it to support an equipment purchase or a change in operating policy.
Source: Hashrate Index / Luxor ↗
Mining calculator ↗