Eurostat puts EU household electricity near €0.28/kWh: home miners need their own tariff
Source report: 2026-10-30 · Editorial analysis published: 2026-10-31
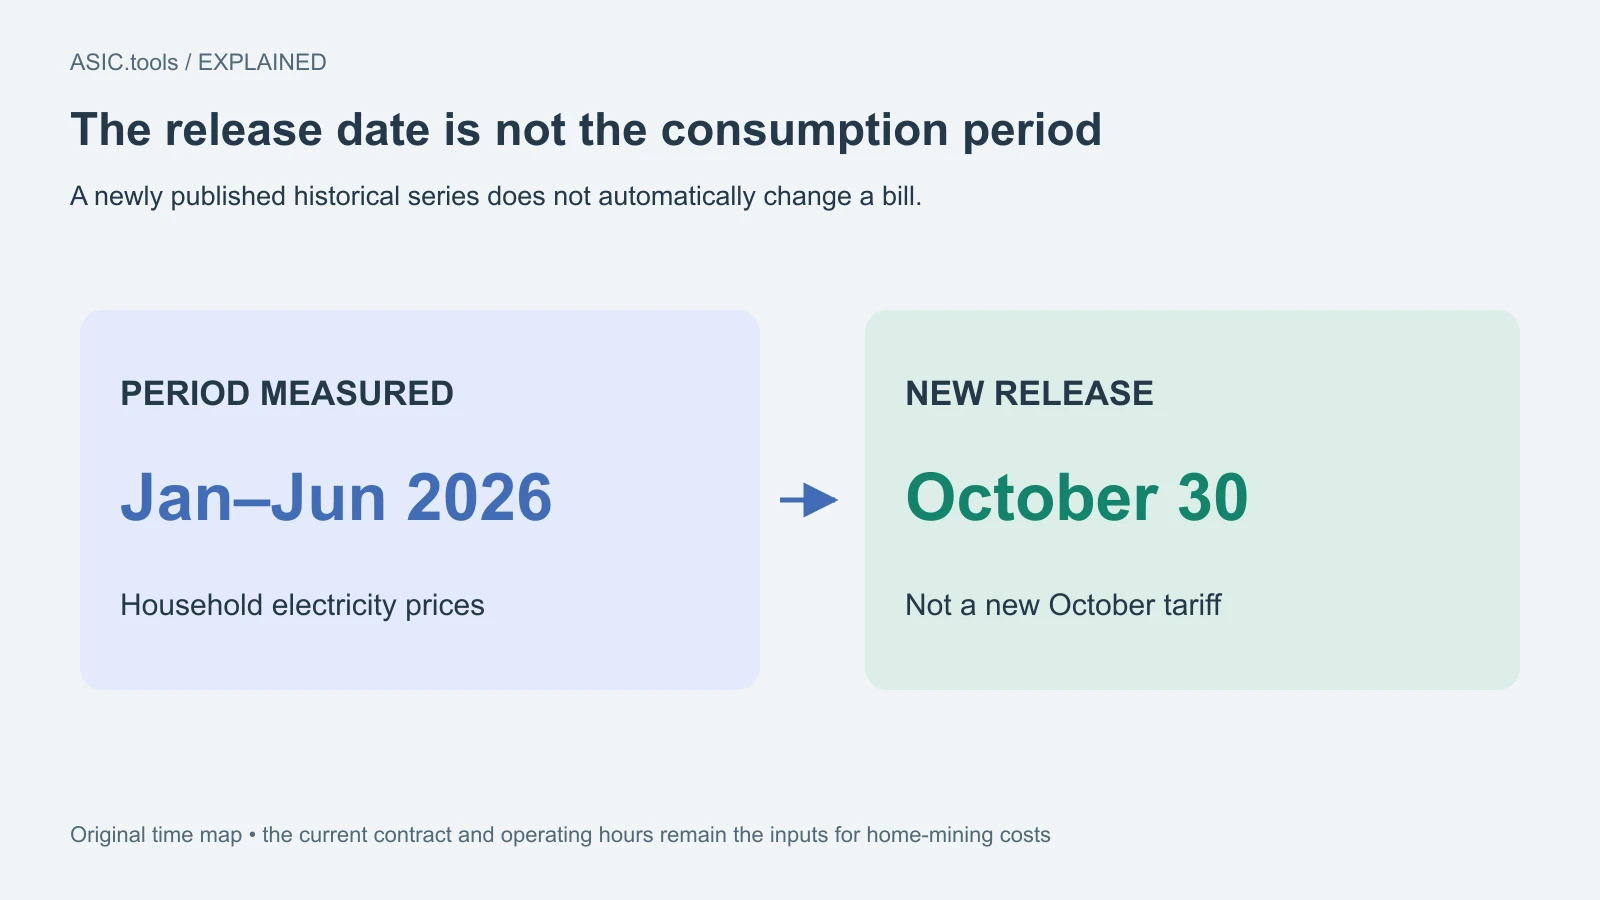
The October 30 release reports a 2.2% decline in the first half of 2026 from the previous half-year. This is newly published historical data, not an October tariff cut; country averages still differ sharply.
A small average decline, published after the period
Eurostat published new household electricity figures on October 30. Its news release puts the EU average in January–June 2026 at about €0.28 per kilowatt-hour, 2.2% below the previous half-year. A kilowatt-hour, or kWh, is the energy a device drawing one kilowatt uses in one hour. For a home miner, the important message is that a modest average decline still leaves electricity a substantial running cost.
The publication date and the consumption period are different. These numbers describe the first half of the year; they do not establish what a supplier charges in October or promise a lower next bill. Eurostat also says prices remain above pre-2022-crisis levels. Treat the release as a useful benchmark when checking a contract, rather than a new tariff offer available throughout the EU.
The country gap matters more than the headline
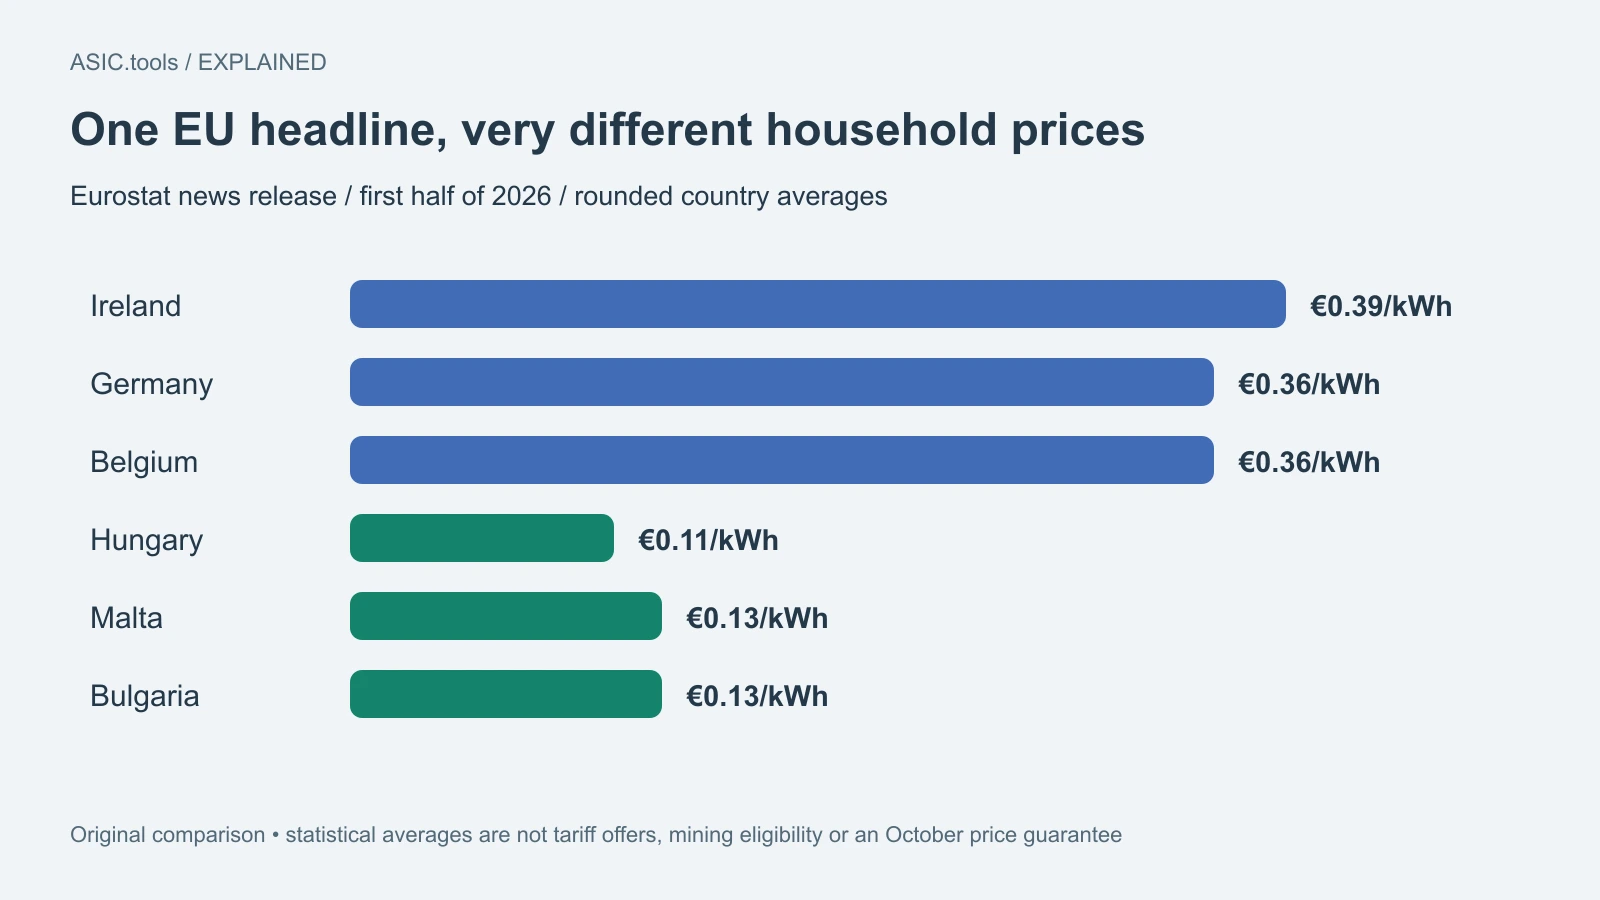
The news release rounds Ireland’s household average to €0.39/kWh, Germany and Belgium to €0.36, Hungary to €0.11, and Malta and Bulgaria to €0.13. Those figures show why the same machine can face very different electricity costs. They are statistical averages, not offers that every household in those countries can obtain, and they do not establish that every mining installation qualifies for a residential contract.
The detailed methodology focuses on household consumption between 2,500 and 5,000 kWh a year. Prices include taxes, network charges and other bill components; the EU figure is weighted by consumption. Non-household figures use different consumption bands and exclude recoverable taxes. A commercial farm should therefore compare its actual contract and tax treatment, rather than taking a household or industrial headline as a ready-made hosting rate.
What the rounded average means for a small load
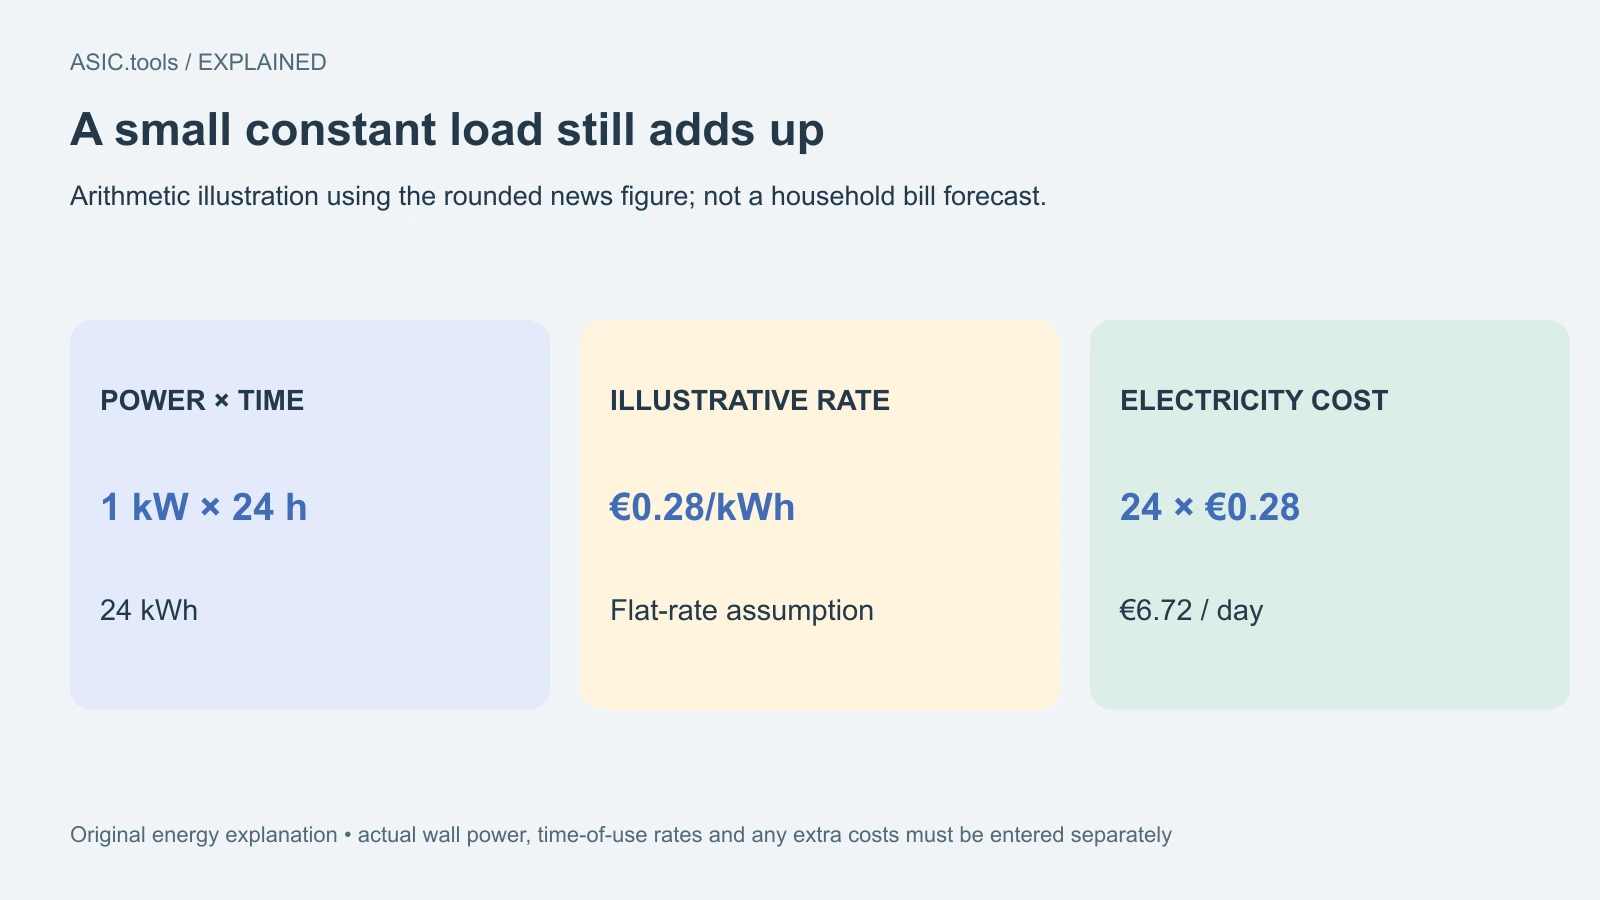
As a simple illustration, a constant 1 kW miner uses 24 kWh in a day. At an assumed flat €0.28/kWh, that is €6.72 of electricity. This calculation uses the rounded news figure solely to show the scale; it is not a bill forecast. Use measured wall power, including any cooling or control equipment you pay for, and the rate that actually applies to those hours.
A 1 kW load running all year would use 8,760 kWh before the rest of the home is counted. That alone exceeds the household band highlighted in the statistical article. The example explains a practical trap: adding continuous mining can change the household’s usage profile substantially, so a price typical of an ordinary home need not remain a good estimate for the enlarged load.
A lower electricity bill is only one side of mining
A miner earns from computational work, while electricity is billed for energy consumed. Revenue can move with coin prices, network difficulty, pool fees and the time the equipment actually mines. A 2.2% fall in the statistical electricity average does not translate into a 2.2% profit increase for every device. Compare expected net pool proceeds with current energy costs over the same period.
If the miner also heats a room, count useful heat only when it replaces heating that would otherwise be needed. Heat produced in a warm room, or vented outside, is not automatically a household saving. Compare the actual alternative heating method and the hours of useful demand. This keeps a winter heating benefit separate from a year-round assumption that all electricity is effectively free.
How to use the new data without buying the wrong promise
Take the supplier’s current unit rates, fixed charges, time windows and contract end date, then compare the household with and without the intended miner. For a time-of-use plan, price each operating window separately. Avoid adding a fixed charge twice if the home already pays it, but include any additional connection, capacity or plan cost that the mining setup actually creates.
Enter those measured assumptions into the calculator and keep gross revenue separate from the electricity result. Eurostat’s release is a prompt to recheck the inputs, not proof that a specific ASIC has become profitable. A seller’s payback estimate based on a national average deserves the same question as before: which bill, which operating hours and which revenue assumptions produce that number?
Dividing the entire existing household bill by its kWh gives an average cost, which can include fixed charges. The cost of adding a miner is a different question: compare the bill with the additional load against the same home without it. Keep both views if useful, but label them. Otherwise an existing fixed payment can make a small test look more expensive than the extra energy actually costs.
For a fair comparison, keep the measured interval and operating conditions consistent. A short low-power reading during startup should not be paired with a screenshot of peak hashrate from another day. Record the device mode, actual run time and any extra cooling. These practical inputs help turn a broad historical price release into a decision that can be checked again when the contract or equipment changes.
Source: Eurostat ↗ · Electricity price statistics and methodology ↗ · Household price dataset nrg_pc_204 ↗
Mining calculator ↗