Bitcoin ETFs regain $159.5 million after two days of outflows
Source report: 2026-09-17 · Editorial analysis published: 2026-09-18
Farside reports $159.5 million of net inflows on September 17. We calculate the remaining three-day deficit and explain why ETF flows are not miner revenue.
Analysis and practical implications
This section is our analysis and illustrative calculations, separate from the source report.
The latest completed session
Farside’s US spot Bitcoin ETF table shows a $159.5 million net inflow for September 17, 2026. IBIT contributes $183.7 million, while FBTC and HODL show $16.6 million and $7.6 million outflows. The September 15 and 16 totals are negative $450.4 million and $295.9 million. We checked the live table on September 18; that day’s fund cells were still dashes, so its displayed zero is not a completed-session result.
The rebound did not erase the deficit
Our arithmetic adds the two prior outflows: 450.4 + 295.9 = 746.3 million dollars. Subtracting the new inflow leaves a three-session net outflow of $586.8 million. The rebound offsets approximately 21.4% of those two days’ outflows, not all of them. This is a calculation on the cited snapshot; extending the window to include other sessions answers a different question and requires a new subtotal.
Do not confuse flows with turnover
Our reporting method labels net flow, trading turnover and assets under management separately. A dollar traded between two secondary-market participants is not automatically a dollar of net fund inflow. Likewise, asset values can move with Bitcoin’s price without the same movement in new capital. Before combining charts, confirm that both series describe the same quantity, date convention and currency rather than simply sharing a dollar symbol.
ETF demand is not a miner payout
For a miner, our suggested operating dashboard keeps ETF flows as market context. The revenue ledger instead starts with accepted mining work, pool settlement and actual Bitcoin receipts, then converts them at a stated rate. Electricity and hosting costs need their own records. There is no direct accounting identity that transfers a given ETF inflow percentage into the same percentage increase in an ASIC’s daily payout.
Use sensitivity tests for farm budgets
Our budget recommendation changes one input at a time: Bitcoin conversion price, effective work, downtime or the electricity tariff. Keep every scenario explicitly hypothetical and compare against the same baseline. A positive flow headline is not a substitute for testing a weaker price or higher cost case. The purpose is to see which variable matters most to your own operation, not to turn a daily fund table into a guaranteed price direction.
Time zones and incomplete rows matter
Our date check distinguishes a US trading session from the Kyiv date on which the newsroom reads it. At an afternoon Kyiv check, today’s US session can still be pending or underway. Preserve the source snapshot and retrieval time, and mark missing fund cells as incomplete rather than assuming zero activity. If the source later revises a prior total, update the documented calculation and disclose the revision instead of silently mixing snapshots.
A daily rebound is not a trend guarantee
Our interpretation is deliberately narrow: the latest completed row reverses the direction of the previous two daily totals, while the three-day net remains negative. A longer-run trend needs a stated window and consistent observations. The table alone cannot tell us why each investor acted or establish a causal Bitcoin price forecast. Keep the confirmed flow result separate from speculation about motives, future rate decisions or a miner’s investment return.
What miners should monitor next
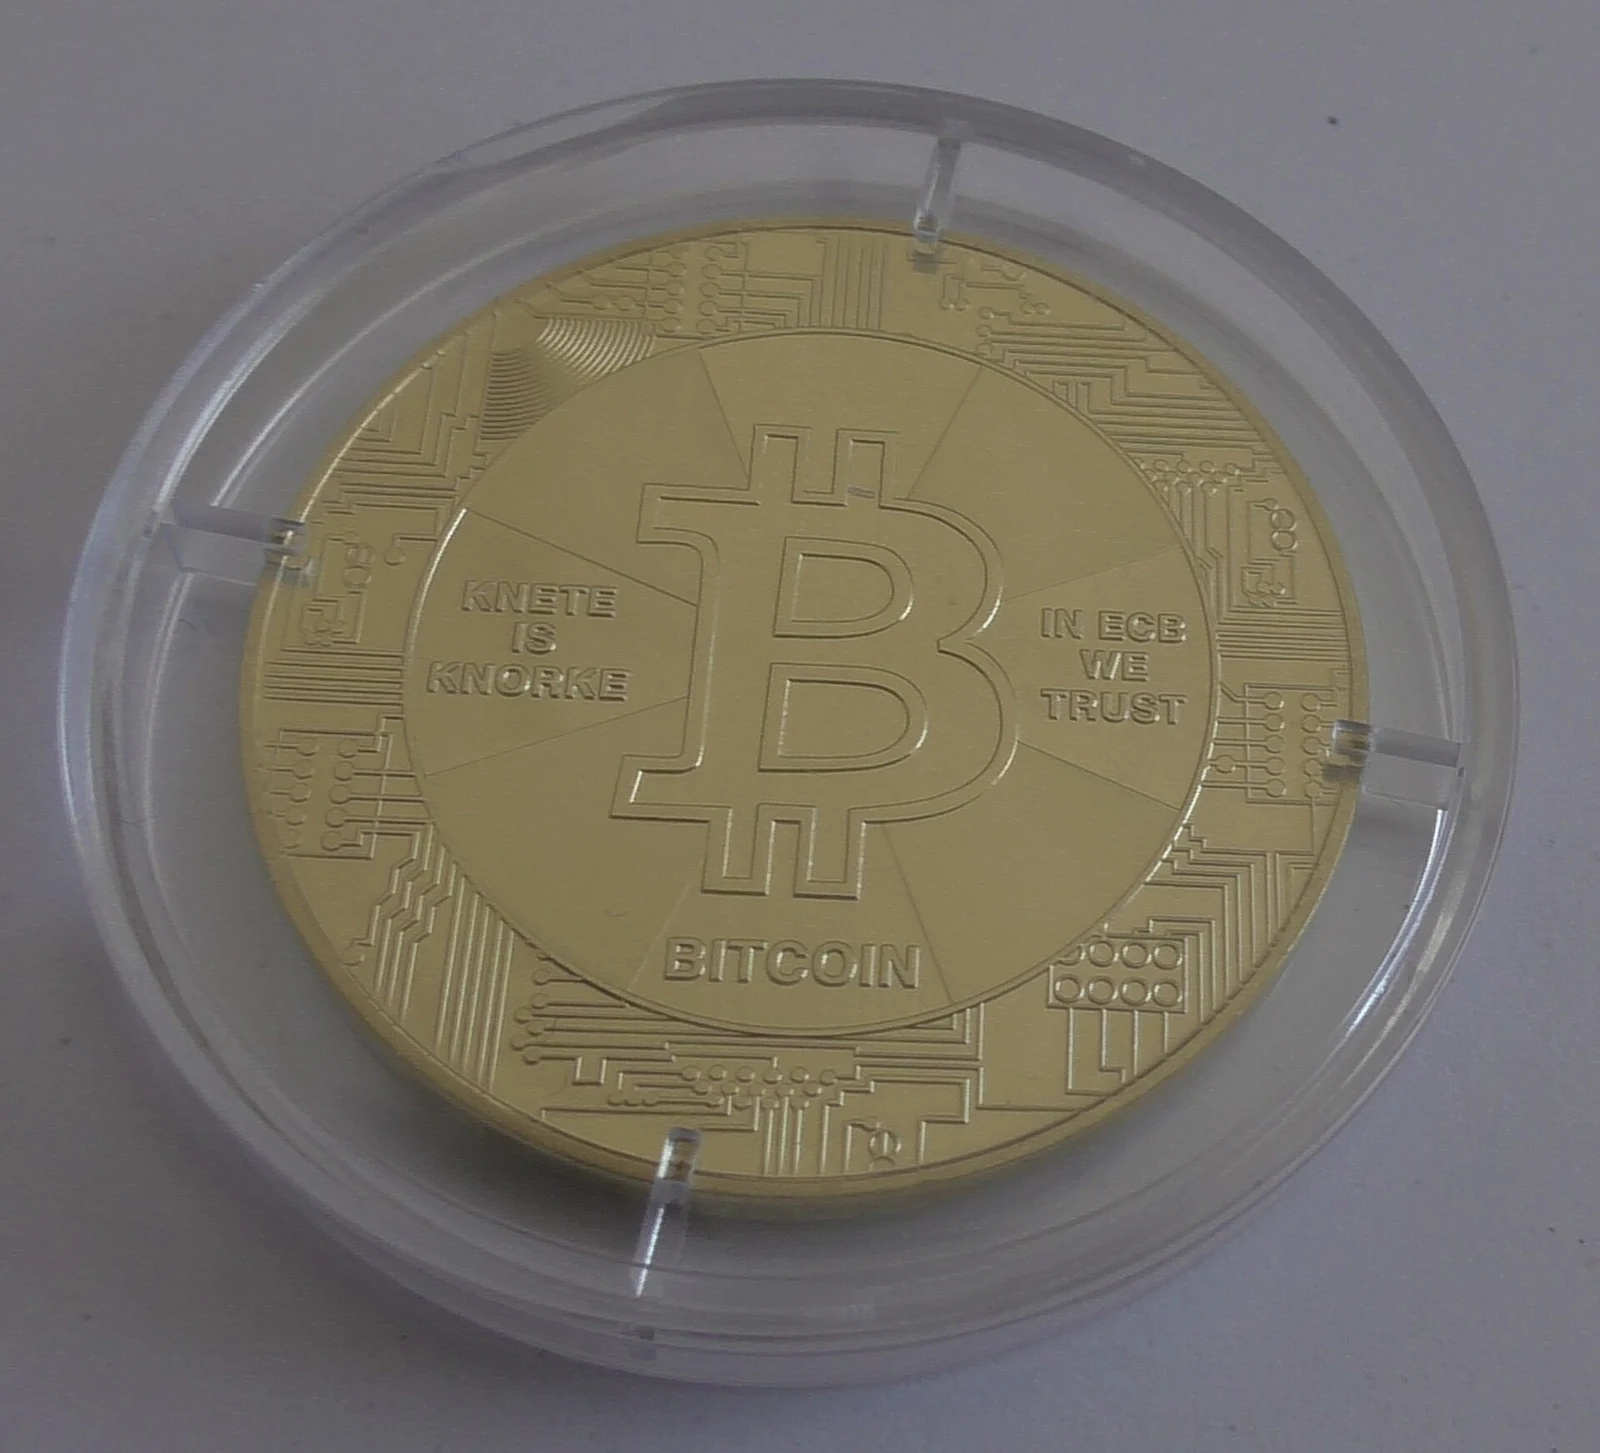
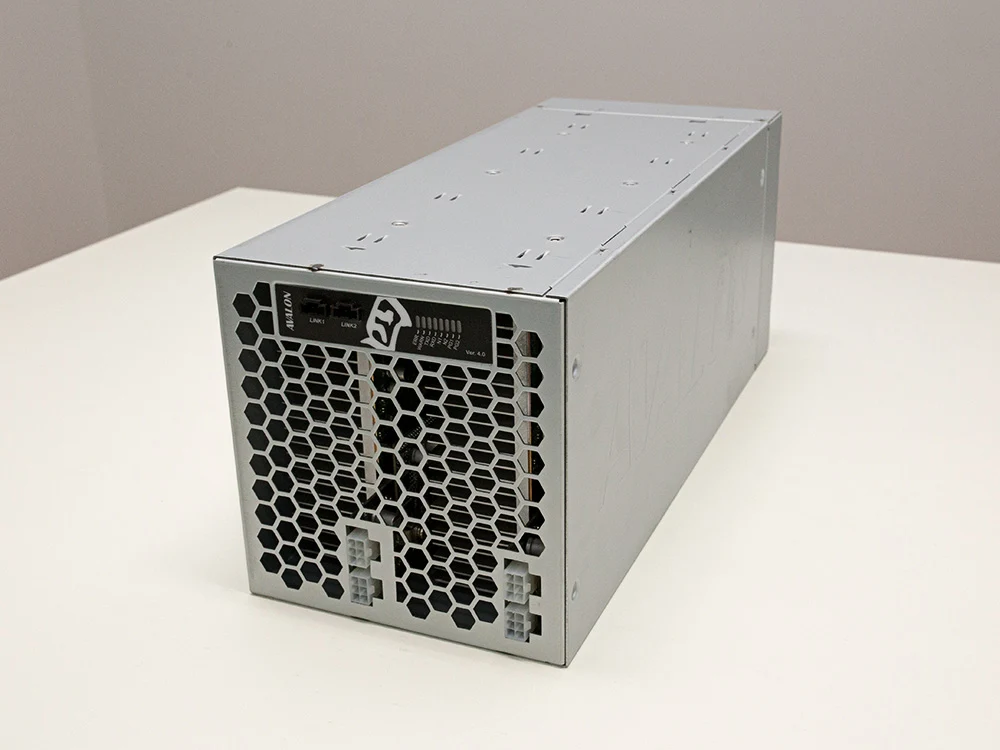
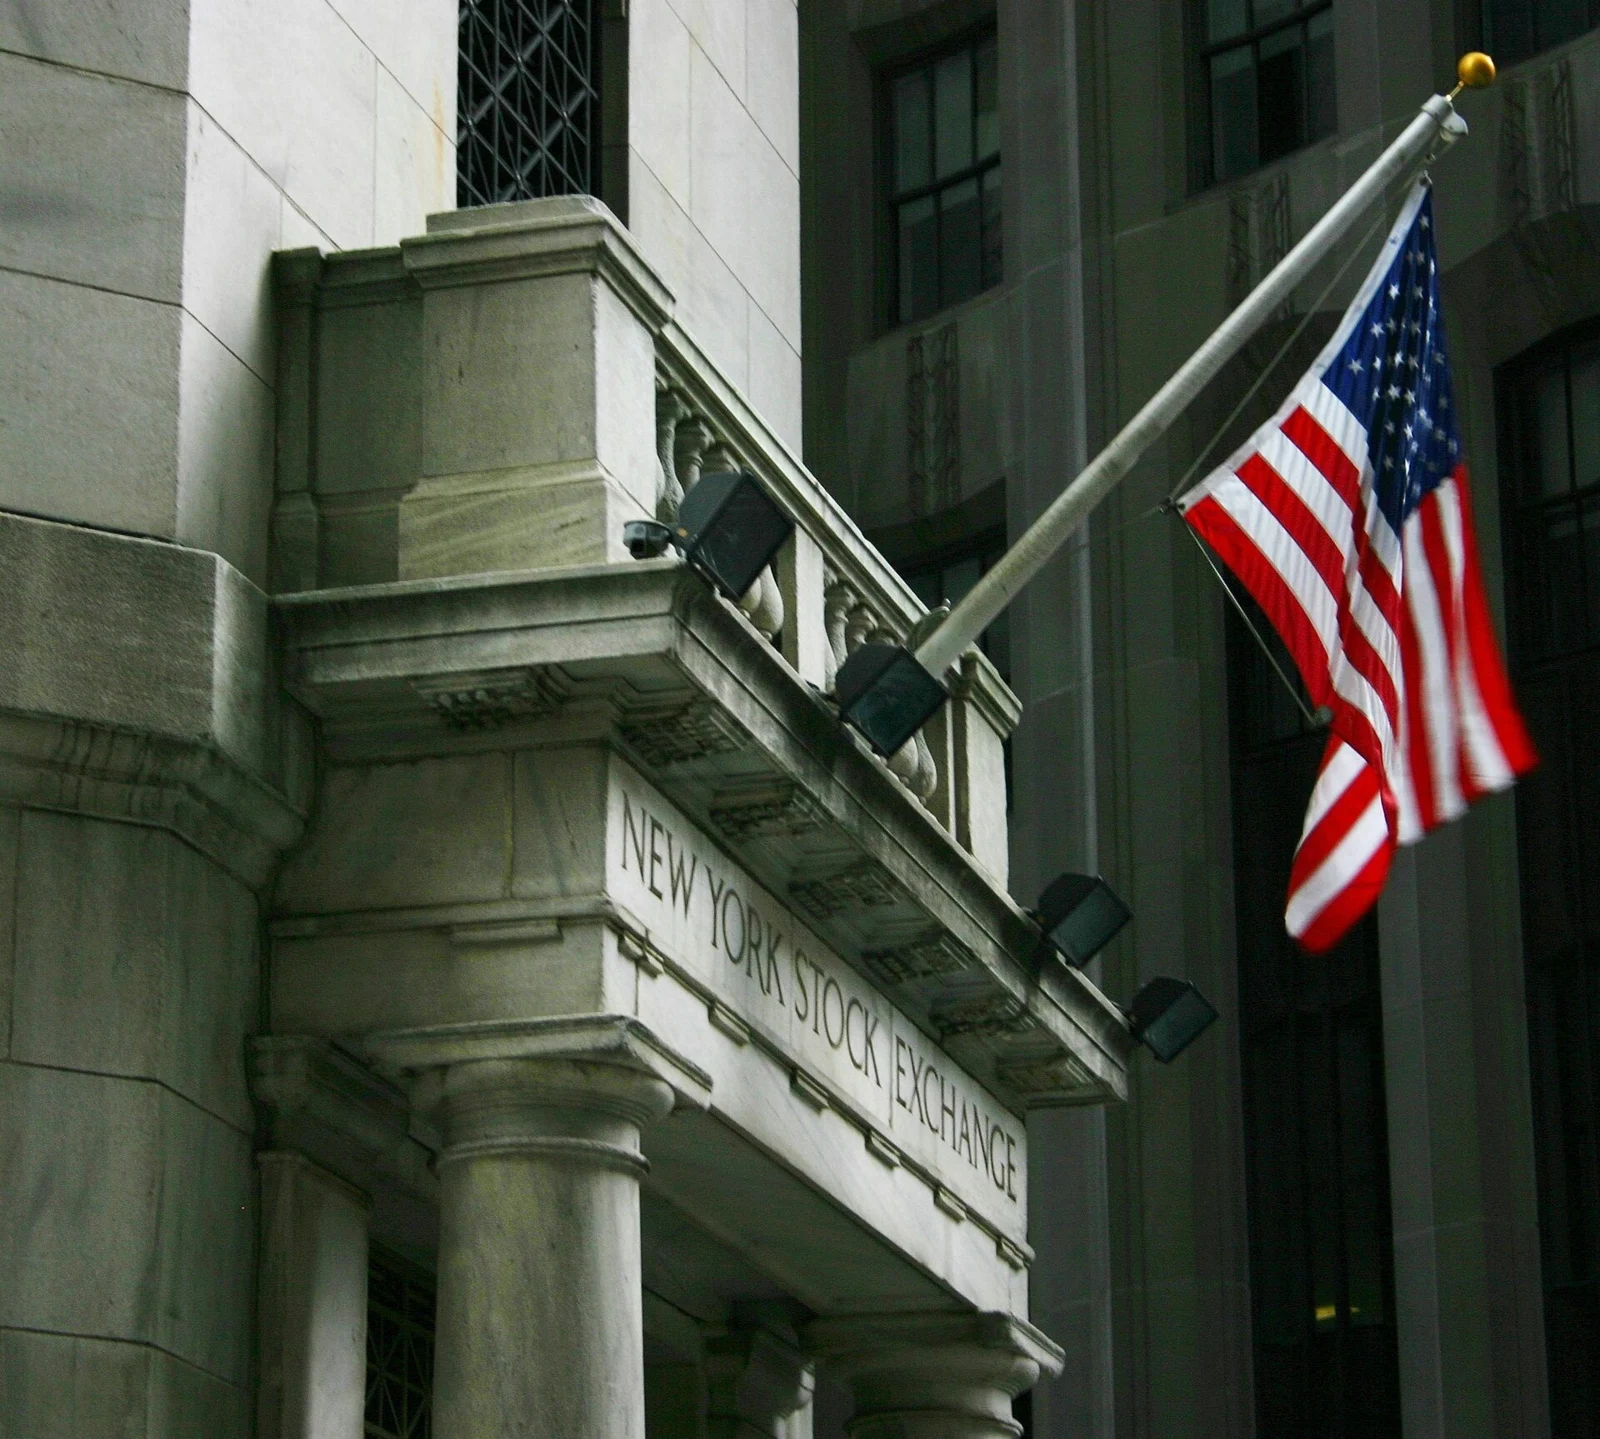
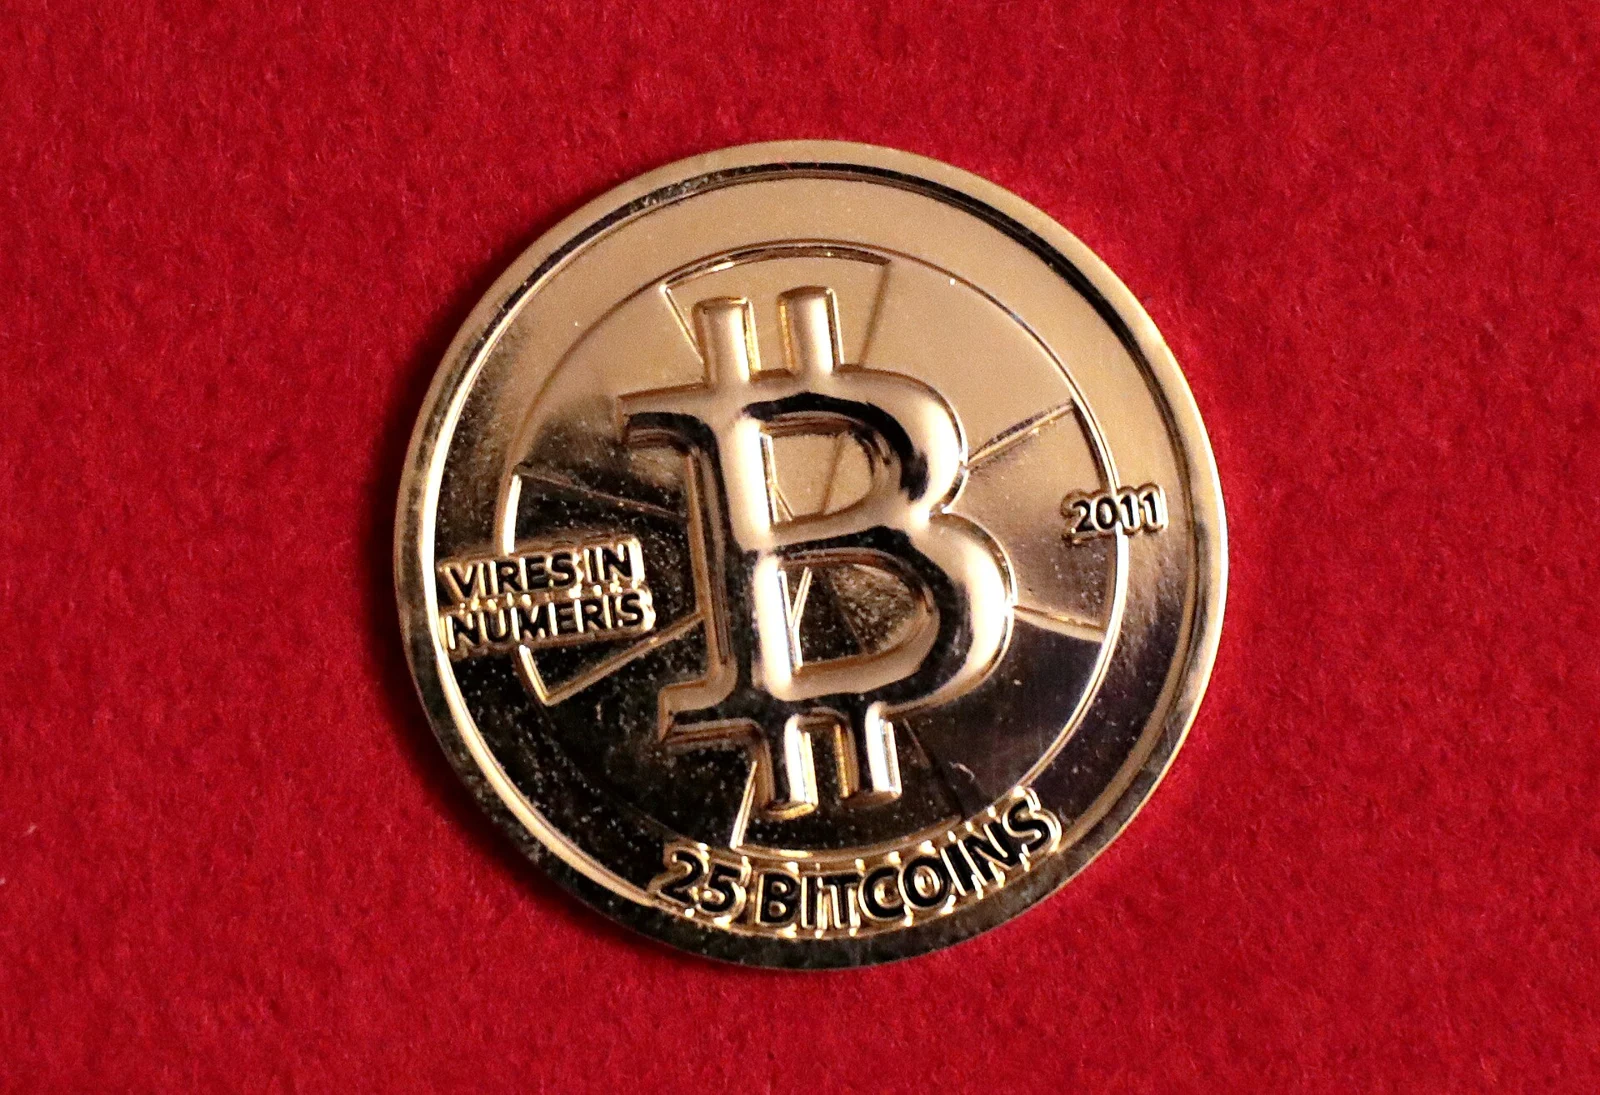
Our practical follow-up is to watch subsequent completed flow rows alongside a separately maintained farm ledger: accepted work, actual receipts, metered costs and downtime. Record any change in the source data before recalculating. This article provides market context and arithmetic, not a buy or sell instruction. Its licensed archival images illustrate a financial district and Bitcoin; neither depicts an ETF transaction or equipment whose profitability was tested for this story.
Source: Farside Investors ↗
Mining calculator ↗