FutureBit examines Bitcoin difficulty and expected BTC yield
Source report: 2026-09-16 · Editorial analysis published: 2026-09-17
An independent calculation explains why a difficulty decline and an expected-yield increase have different percentages.
Analysis and practical implications
This section is our analysis and illustrative calculations, separate from the source report.
The dated snapshot
FutureBit published a September 16 difficulty analysis. It compares 155.973 trillion at the October 2025 peak with 127.451 trillion in its snapshot. The comparison concerns expected subsidy output at unchanged effective hashrate.
Check both denominators
ASIC.tools independently recalculated the two percentages. The difficulty decline is (155.973 − 127.451) ÷ 155.973, approximately 18.29%. The reciprocal output comparison is 155.973 ÷ 127.451 − 1, approximately 22.38%. They answer different questions and therefore are not contradictory. The first measures a reduction relative to the old difficulty; the second measures an increase relative to the old expected yield. These are our calculations from the dated inputs, not fresh measurements of a miner or a forecast of the next adjustment.
Expectation is not a payment promise
An independent hypothetical example makes the distinction concrete. If a fixed amount of work previously had an expected subsidy yield of 0.001 BTC, multiplying by the ratio gives approximately 0.0012238 BTC under the new difficulty assumption. It does not establish an actual pool payment or a solo block win. Keep the assumed work, subsidy and observation period unchanged when making this comparison. Label the result as expected subsidy rather than total income, and record any other revenue components separately. The example is not a quoted return for a FutureBit product.
The electricity bill does not follow the ratio
For a deliberately hypothetical 2 kW device, uninterrupted 24-hour operation uses 48 kWh before auxiliary loads. A different Bitcoin difficulty does not by itself change that arithmetic. To evaluate a farm, combine the selected operating profile with actual electricity readings, tariff and downtime. Then test more than one difficulty and BTC valuation scenario. A higher expected coin quantity can coexist with a worse cash result if other inputs deteriorate. Compare the full operating budget, not a favorable percentage in isolation; our calculator lets the reader change model and tariff assumptions.
Use accepted work and uptime
For a before-and-after test, record accepted work over comparable intervals rather than one local dashboard screenshot. Note firmware, operating profile, restarts and rejected work. A configuration change can alter the experiment even when the network difficulty is known. If an interval contains missing data, mark it and explain whether the comparison remains usable. Match electricity and pool records by timestamp. This is an editorial measurement plan; ASIC.tools has not benchmarked the manufacturer’s devices or tested a production improvement on a home installation.
Solo outcomes remain irregular
A better mathematical chance per unit of work does not create a regular solo payment schedule. Distinguish expected value from the result observed in one day or month. For a hypothetical comparison, two devices can have the same expected yield but different observed outcomes over a short period. Do not turn an isolated block win into a general payback estimate. When recording a solo test, preserve the work performed and the exact period, including periods with no block. Omitting zero-result intervals produces a misleading picture of the experience.
A snapshot expires
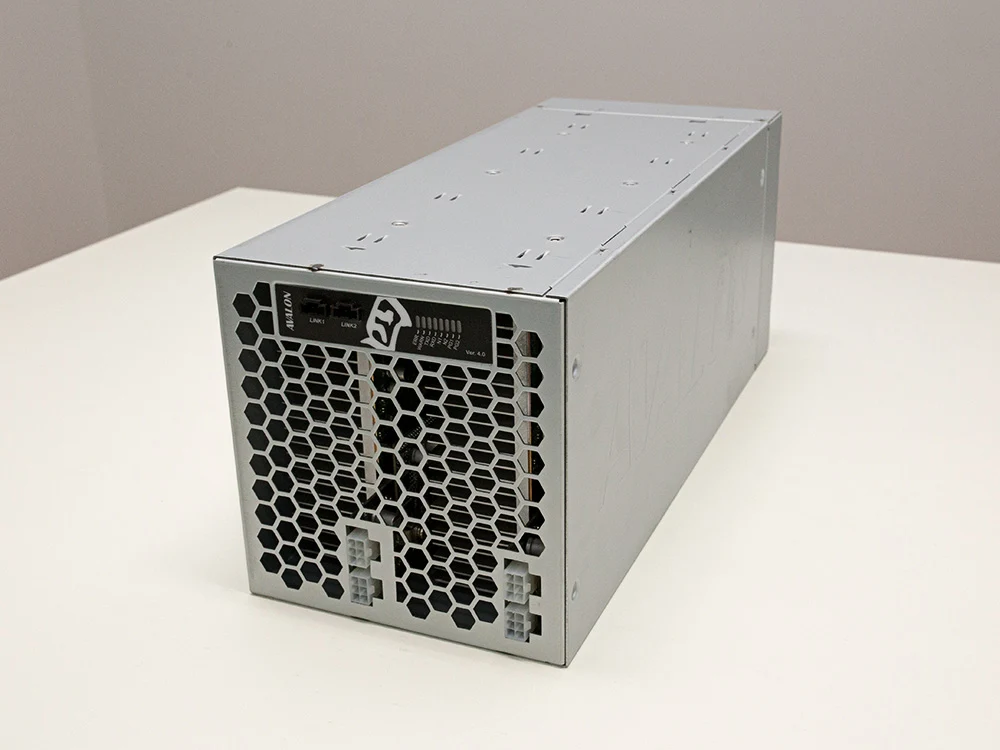
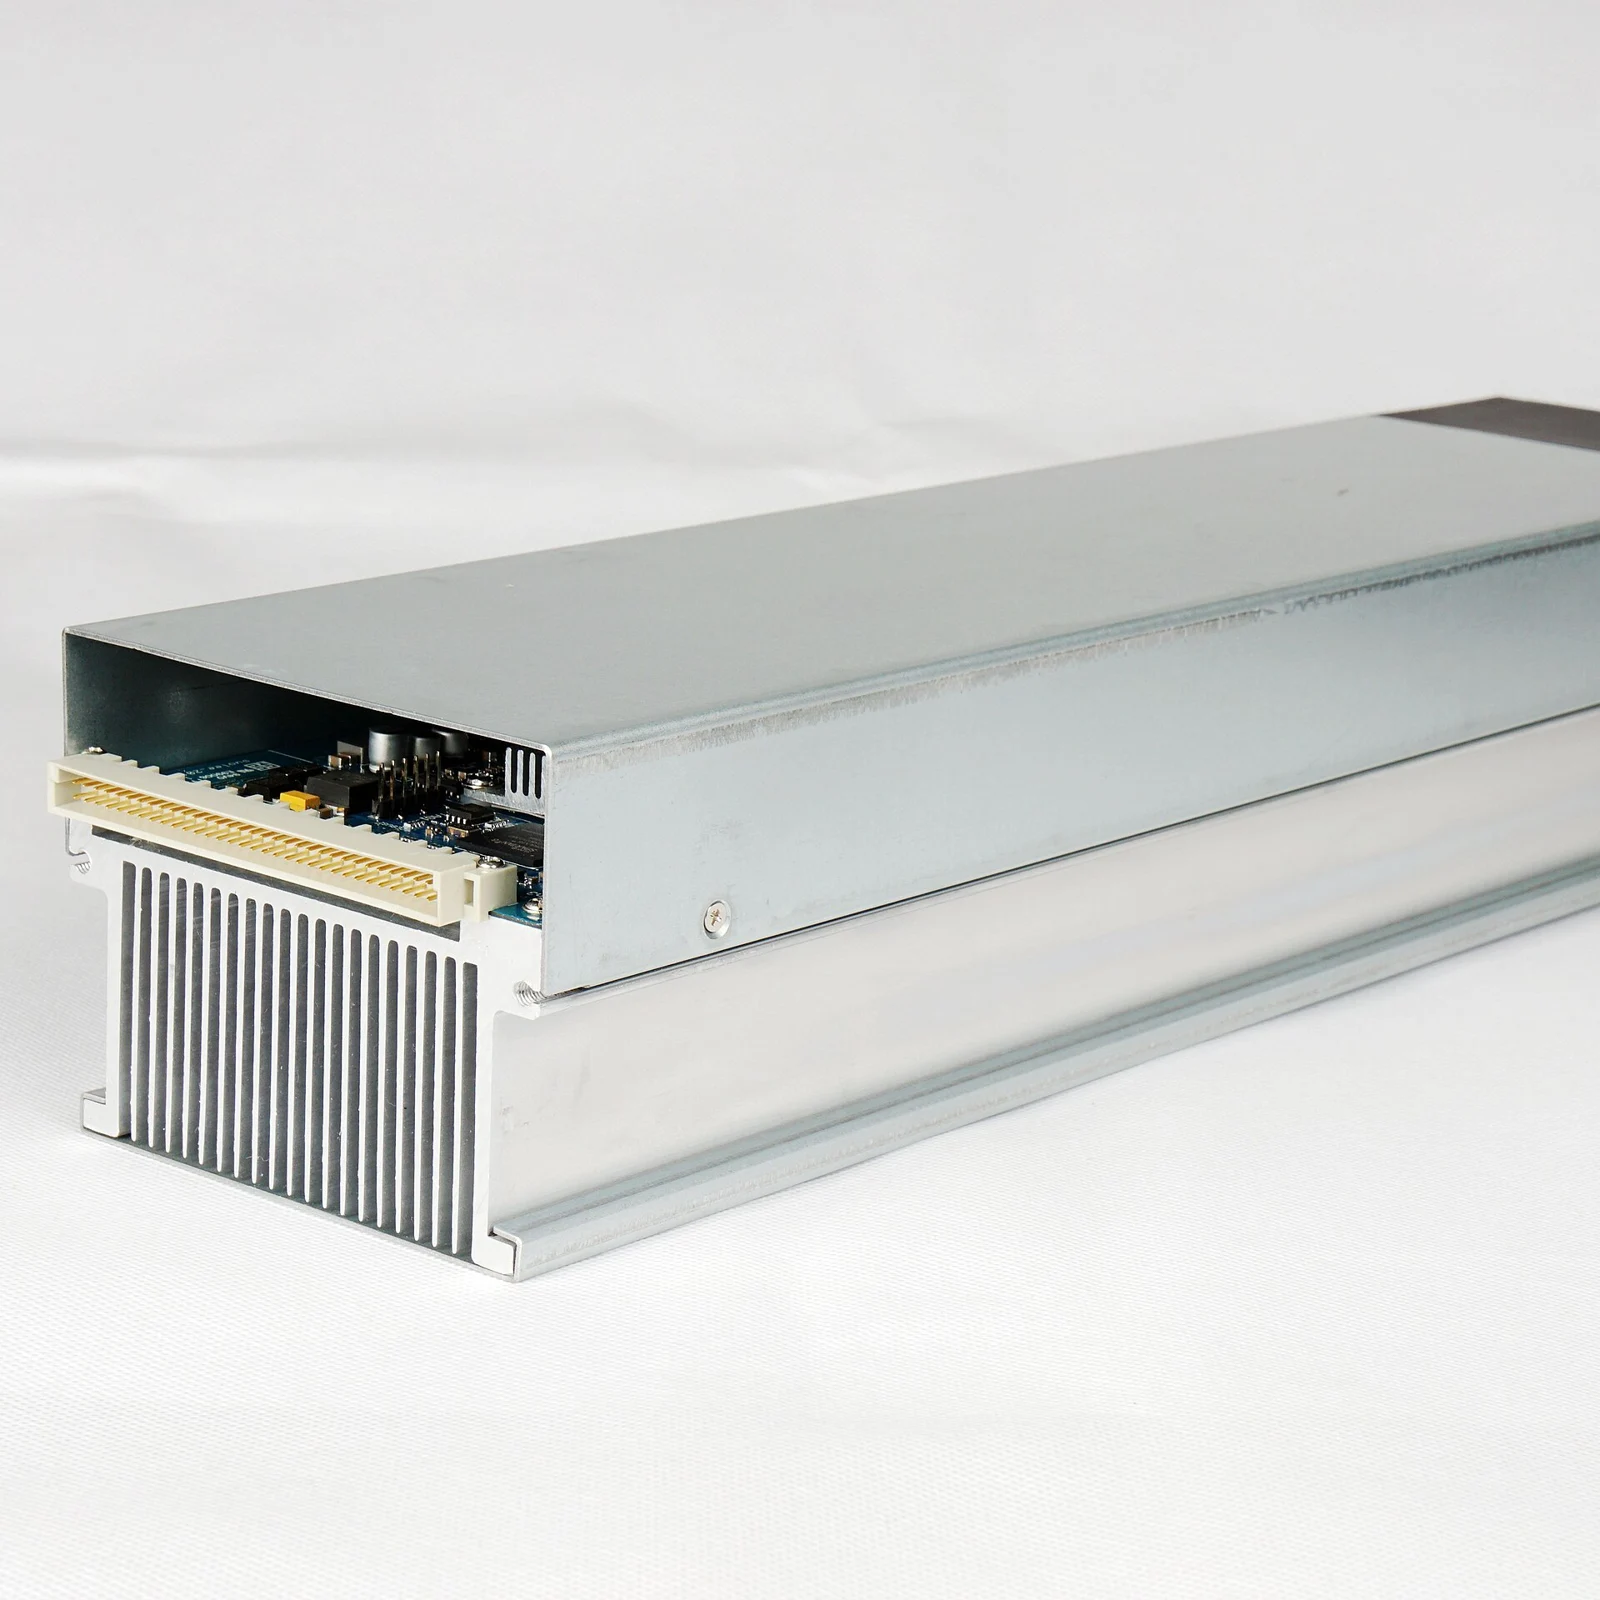
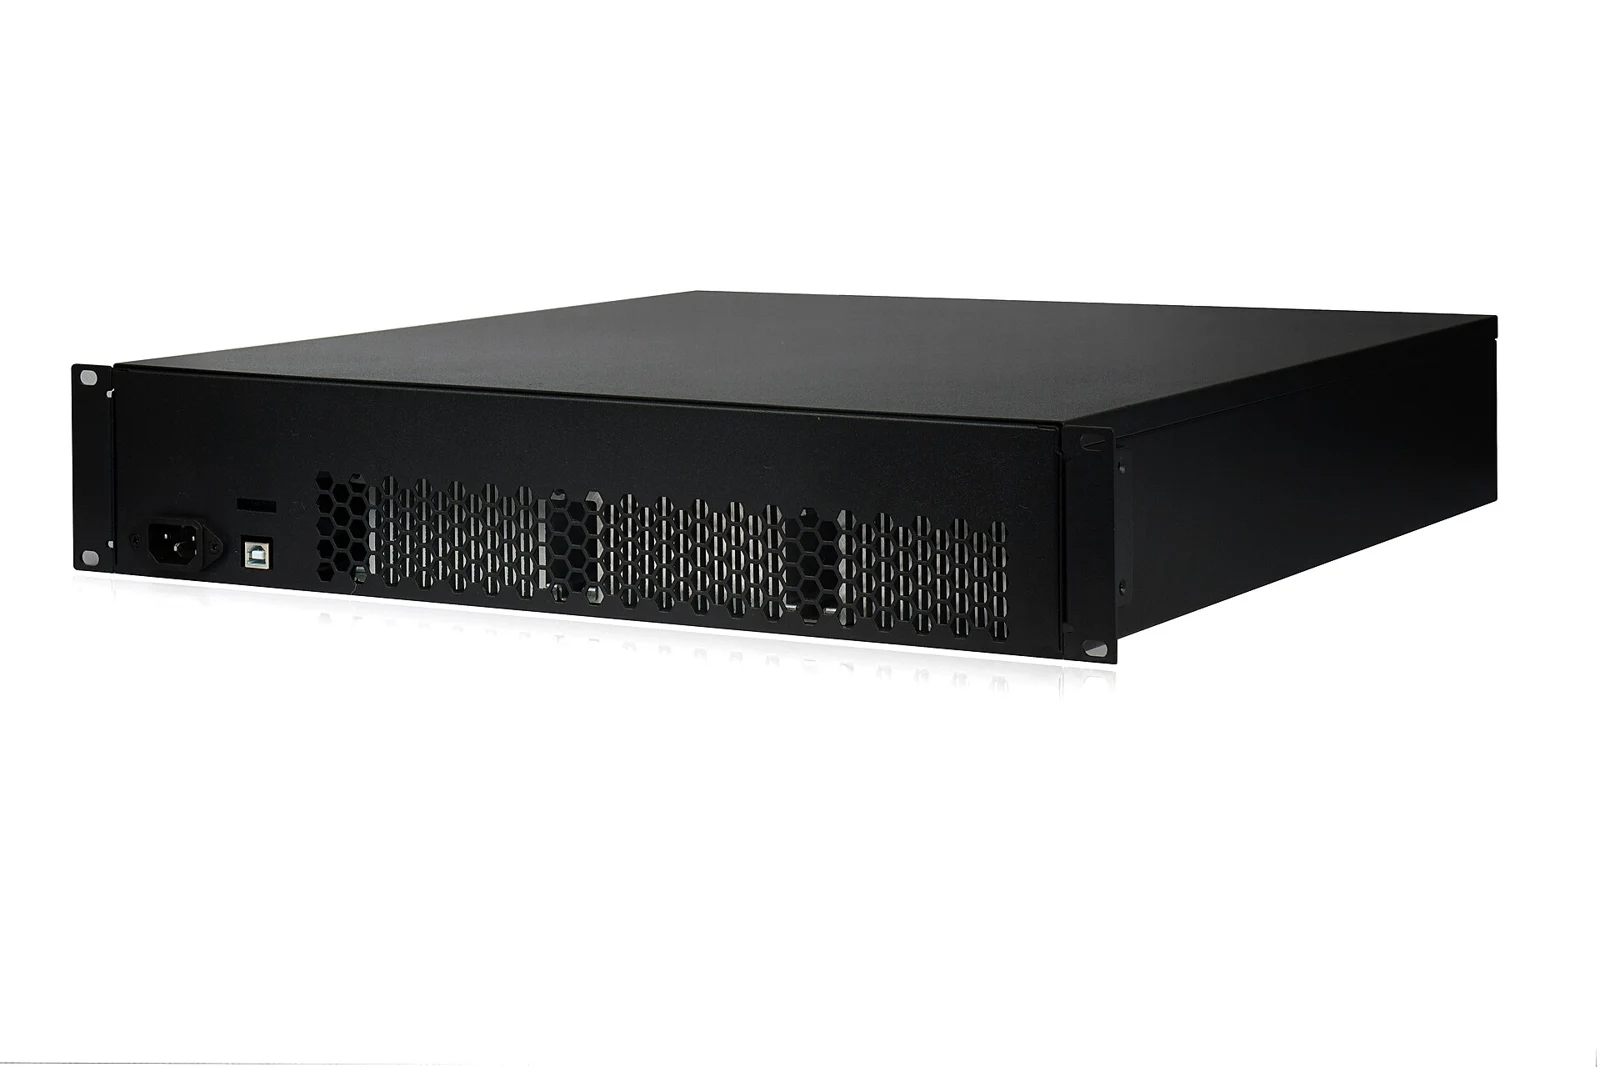
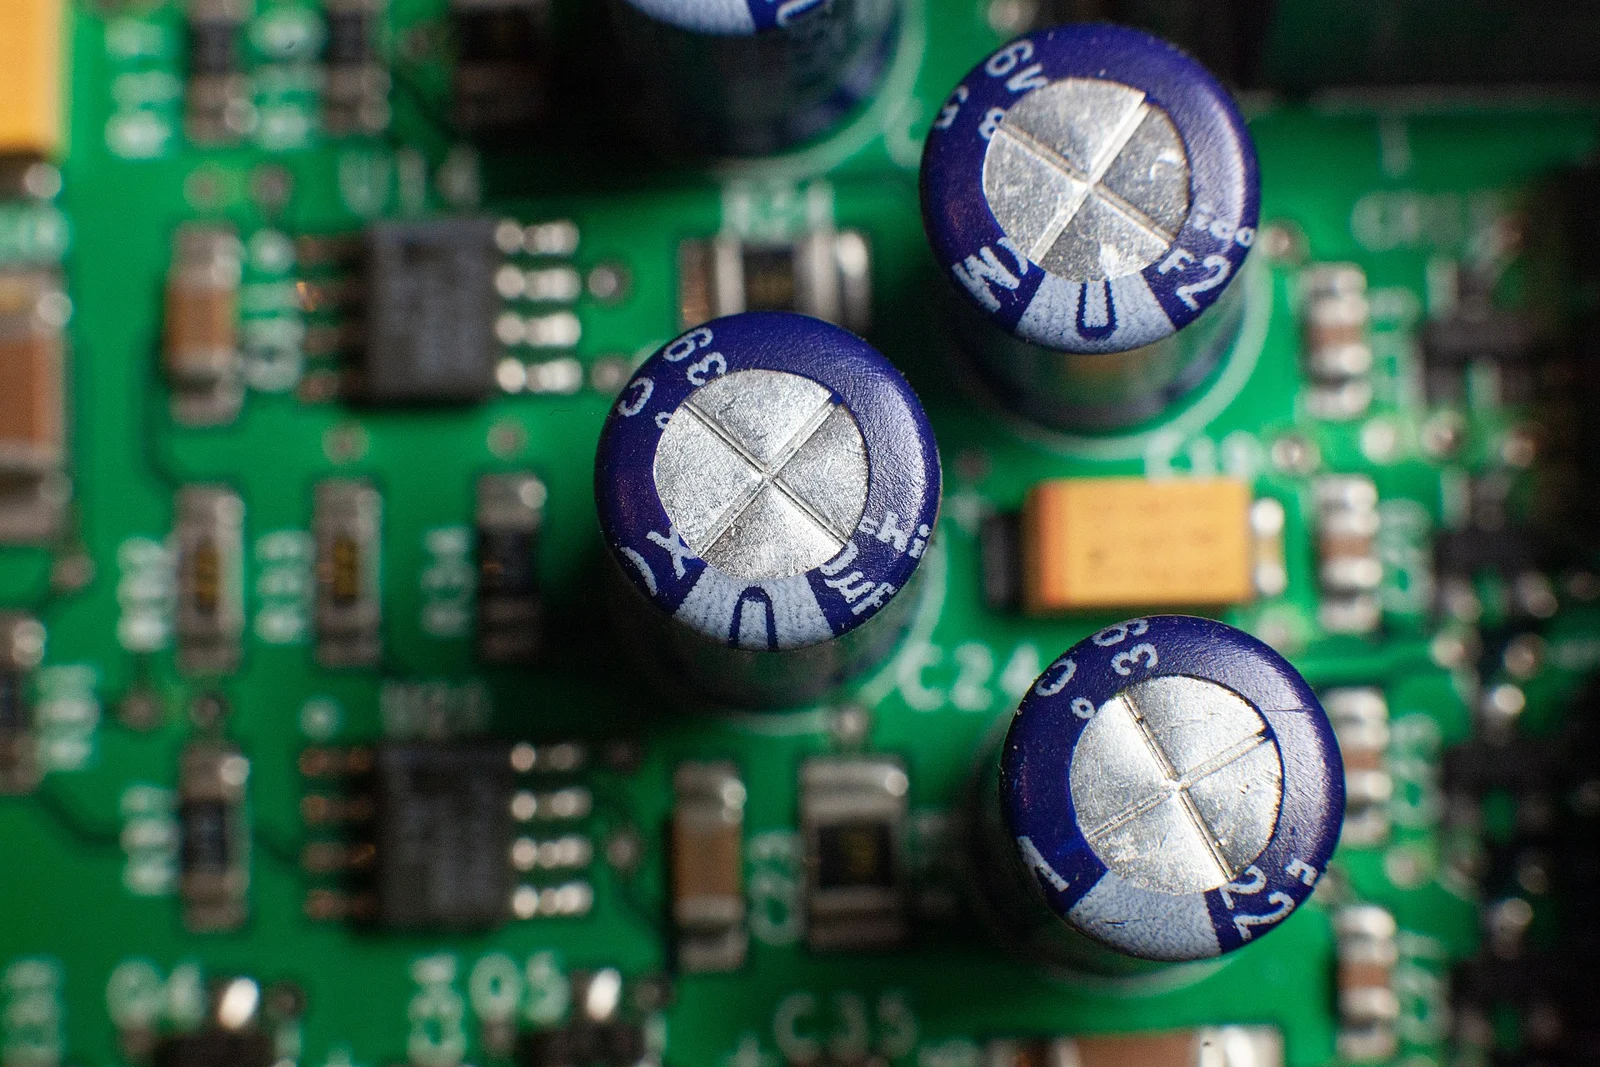
Keep September 16 attached to these inputs. A later network adjustment can change the comparison, so a static article should not be mistaken for a live calculator quote. Update your own scenario with the applicable difficulty and timestamp, then preserve the previous version for review. A difficulty change is separate from a miner’s hardware hashrate change. The two archive images illustrate older mining hardware and electronic components; neither depicts a FutureBit product or a current farm. No new model or firmware is inferred from this economic analysis.
A useful comparison worksheet
Use separate columns for measured work, expected subsidy, actual pool credits, energy and cash expenses. Keep the comparison boundary consistent and flag changes in equipment count. A record that another person can reproduce is more useful than a percentage without its assumptions. Before making a purchase, identify which inputs came from the manufacturer, which came from your meter and which are only scenarios. This prevents a commercial explanation from silently becoming evidence of your own future result. Review the dated snapshot again when difficulty changes; preserve the earlier assumptions so subsequent revisions can be traced.
Do not confuse gross output with margin
In a hypothetical budget, gross income of 100 units and unchanged costs of 80 units leave a margin of 20. If gross income rises to 122.38 while costs remain 80, the margin becomes 42.38. This is only an arithmetic illustration, not a market quotation or forecast. Electricity use, fees, exchange rates and operating hours must be measured separately before applying any such comparison to a real machine.
Source: FutureBit ↗
Mining calculator ↗