Bitdeer reports 1,310 BTC produced in August
Source report: 2026-09-16 · Editorial analysis published: 2026-09-17
How to compare monthly Bitcoin production, hashrate and energy without confusing output with profit.

Analysis and practical implications
This section is our analysis and illustrative calculations, separate from the source report.
The August result
Bitdeer’s unaudited August update reports 1,310 BTC produced, versus 1,190 in July, and 79.9 EH/s of self-mining. Published September 16 ET; the release carries a September 17 Singapore dateline.
Growth needs a comparable denominator
ASIC.tools calculation: the difference is 120 BTC, or about 10.1% relative to July. Both months have 31 days, so unequal month length does not explain this particular comparison. This is output growth, not a demonstrated improvement in energy efficiency or profit. A useful comparison keeps the same production boundary, notes downtime and separates coins earned from coins purchased. The percentage says how the reported quantity changed; it does not identify the cause. Our assessment below is an editorial reading method, not an independent audit of Bitdeer’s facilities.
A snapshot is not a monthly average
When an operator publishes a month-end hashrate, resist dividing a full month’s production by that single snapshot and calling the result a fleet benchmark. Machines could have entered service late, stopped for maintenance or changed their operating mode. For a farm log, record accepted hashrate over time, uptime and energy from the meter. A time-weighted average is a better denominator for the period than the highest dashboard reading. Also keep company-operated and externally operated capacity separate: a shared unit of EH/s does not make the business arrangements identical.
Production and cash are separate ledgers
A BTC production figure is not cash received. Coins can remain in treasury, be sold later or be encumbered; each case produces a different cash timeline. For a small farm, reconcile pool credits, wallet receipts, sales and electricity invoices in separate columns. If valuing inventory, record the timestamp and exchange-rate source rather than silently using today’s price for a past month. A hypothetical farm producing 0.02 BTC but selling only 0.01 BTC has not converted all its production to cash. This example is bookkeeping guidance, not a statement about Bitdeer’s transactions.
Energy assumptions determine the comparison
For an ASIC purchase decision, build a model-specific energy budget instead of extrapolating from a public company’s monthly output. Use the power of the exact operating profile, add separately metered cooling and retain actual downtime. As an independent hypothetical calculation, a 3 kW miner running 24 hours consumes 72 kWh per day before ancillary loads. The same hashrate at another tariff can produce a very different operating result. In our catalogue and calculator, compare matching algorithms and adjust the tariff; do not treat a company’s production growth as a promise for your device.
Evidence to collect next
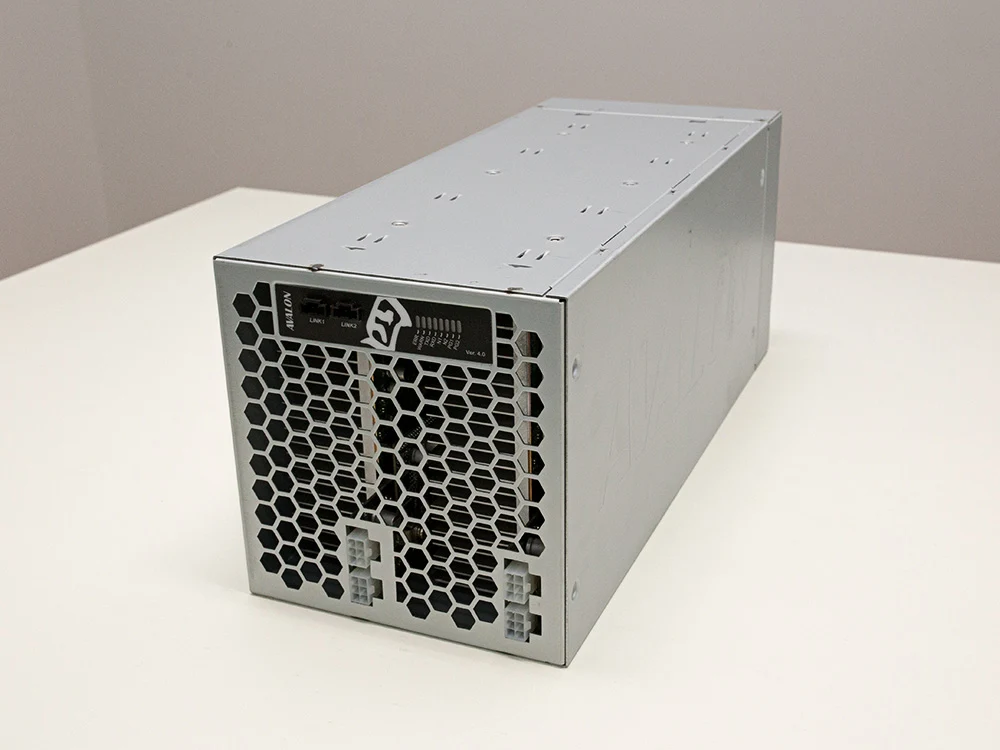
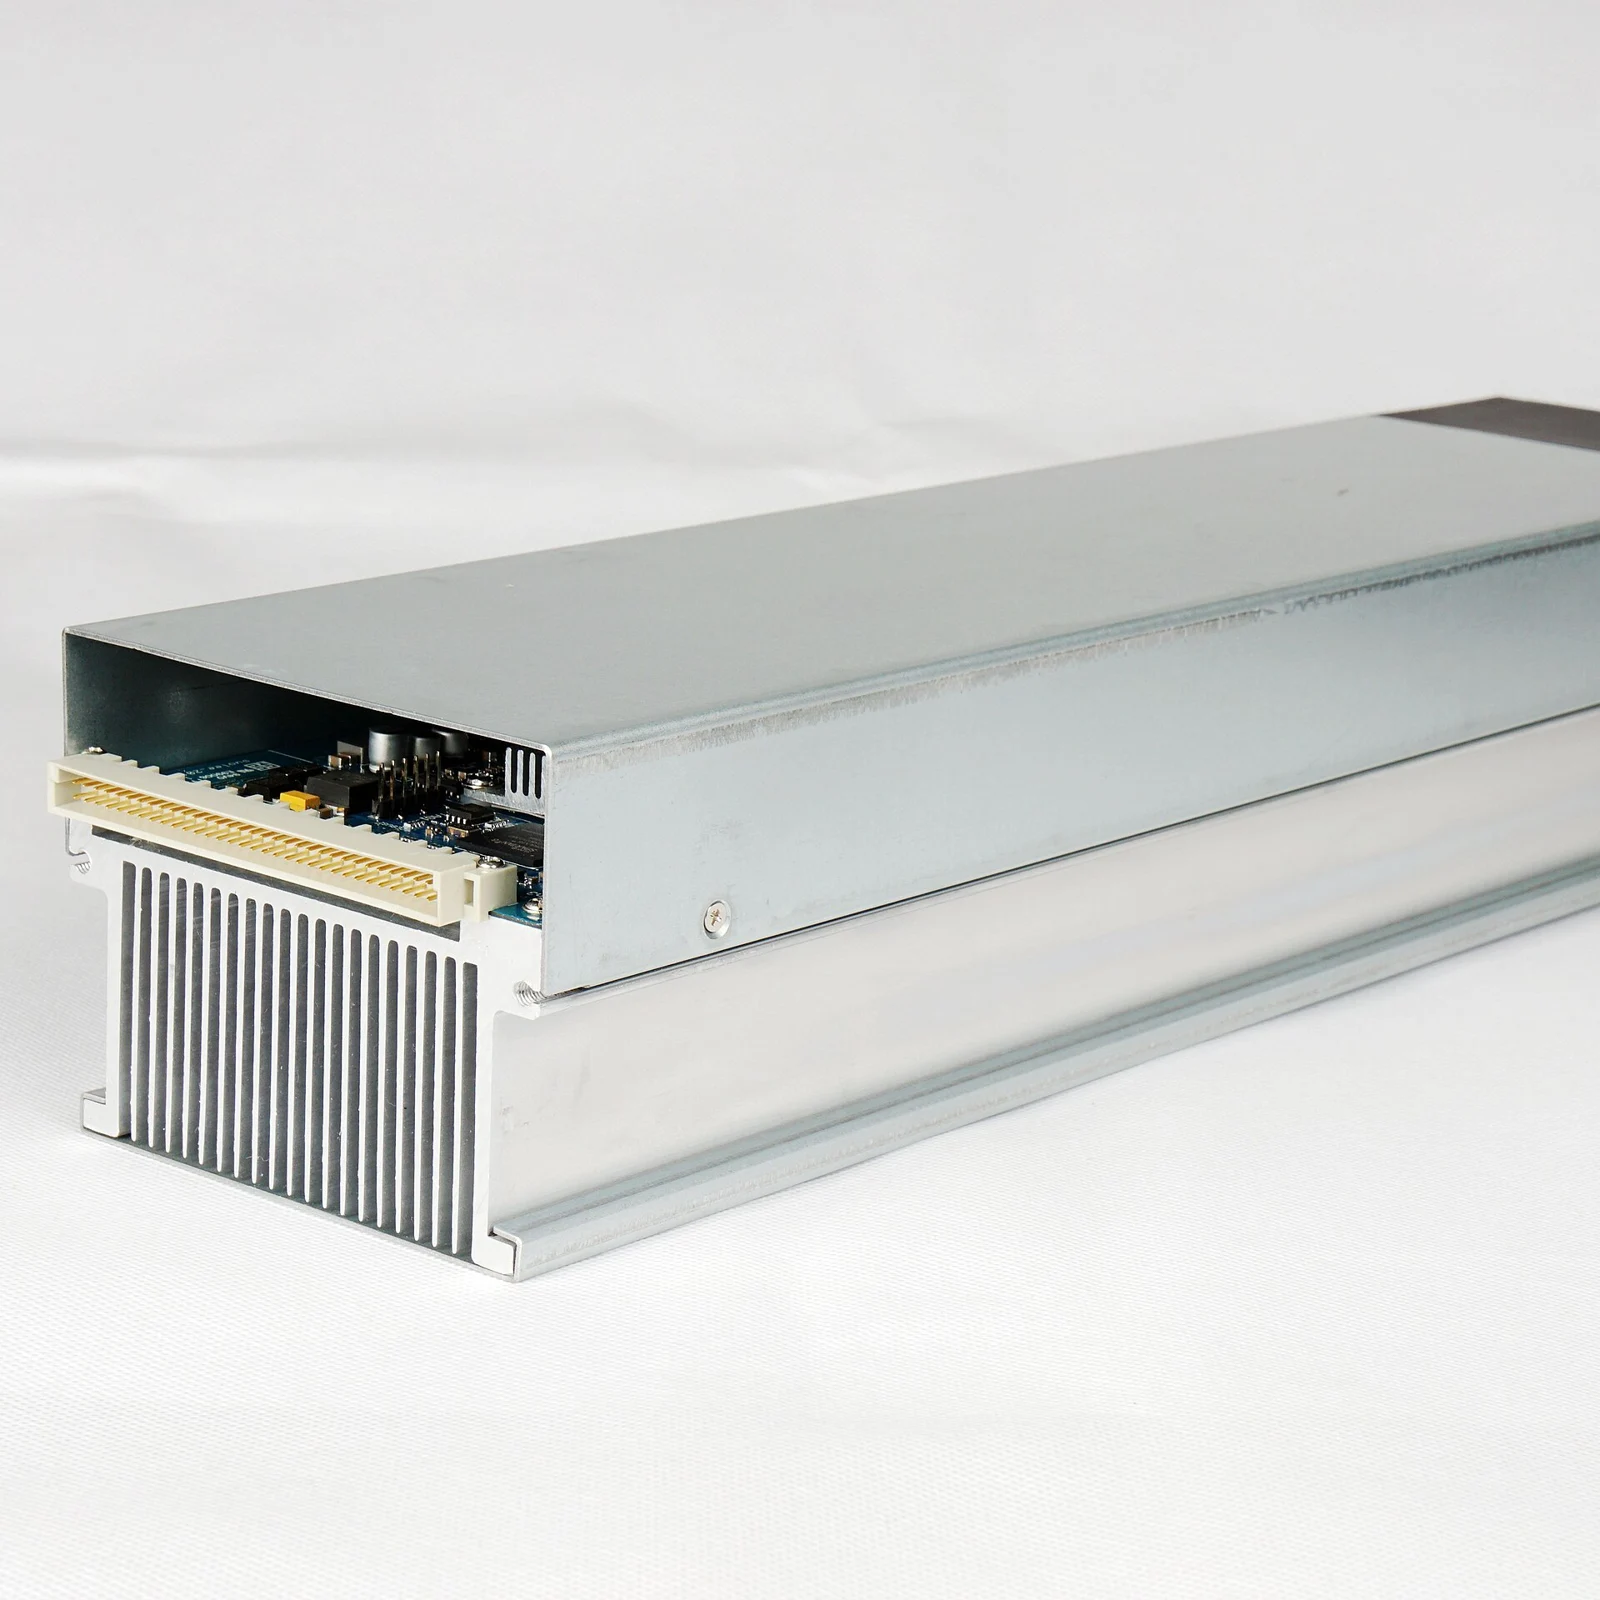
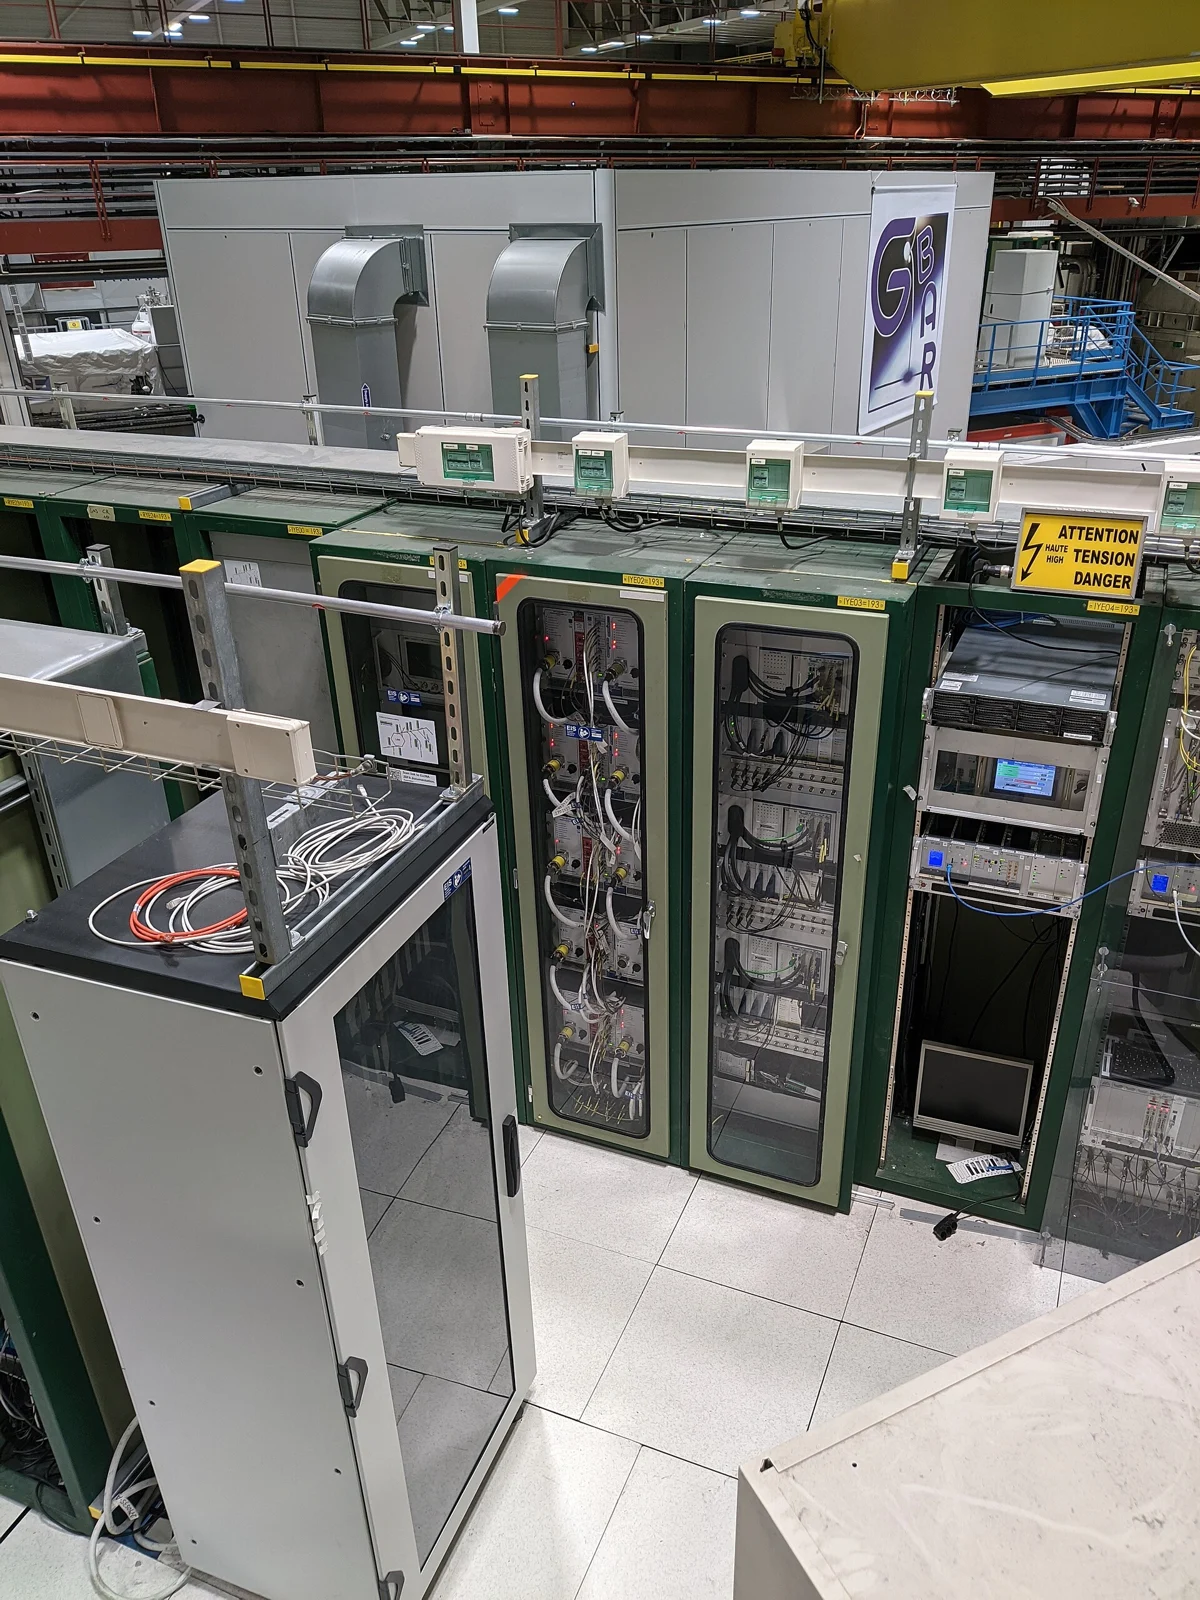
The next operational review should preserve the original release, its reporting period and any later correction. Compare more than one month and keep expansion announcements apart from measured running capacity. Questions worth tracking include the average accepted work, the energy boundary and the treatment of externally operated machines. None can be answered by a production headline alone. The two photographs here are licensed archival illustrations of computing infrastructure, not images of Bitdeer’s sites. We have not measured the fleet or verified individual worker accounts; source figures and our illustrative calculations remain explicitly separate.
A reproducible operating worksheet
For your own comparison, create one row per measurement interval. Keep the start and end time, active device count, selected profile, accepted work, electricity reading and any outage note together. Preserve the timezone so a pool statement and a meter export can be aligned. Use a visible missing-data marker instead of replacing an unavailable value with zero. After a configuration change, begin a new interval and record the firmware version. A photograph of a dashboard can support a record, but should not replace the underlying export. Make the worksheet reproducible: another team member should be able to calculate the period total without guessing which devices or hours were included. If a result is revised, retain both versions and state why. Before comparing farms, agree which electrical loads each row includes: miners alone, miners and cooling, or the full facility. Then compare equivalent boundaries. Energy per accepted unit of work, downtime and actual expenses can reveal different operational questions; do not collapse all of them into one attractive headline. These are recommendations for the reader’s own records, not additional facts about Bitdeer. No facility-level power data or verified efficiency measurement is inferred from the monthly production figure. The method also applies when switching between operating profiles in our catalogue: preserve the configuration and measurement period so a lower-power setting can be assessed separately from a period with fewer running machines.
Source: Bitdeer / GlobeNewswire ↗
Mining calculator ↗