
Bitcoin difficulty falls year over year
Source report: 2026-07-28 · Editorial analysis published: 2026-09-10
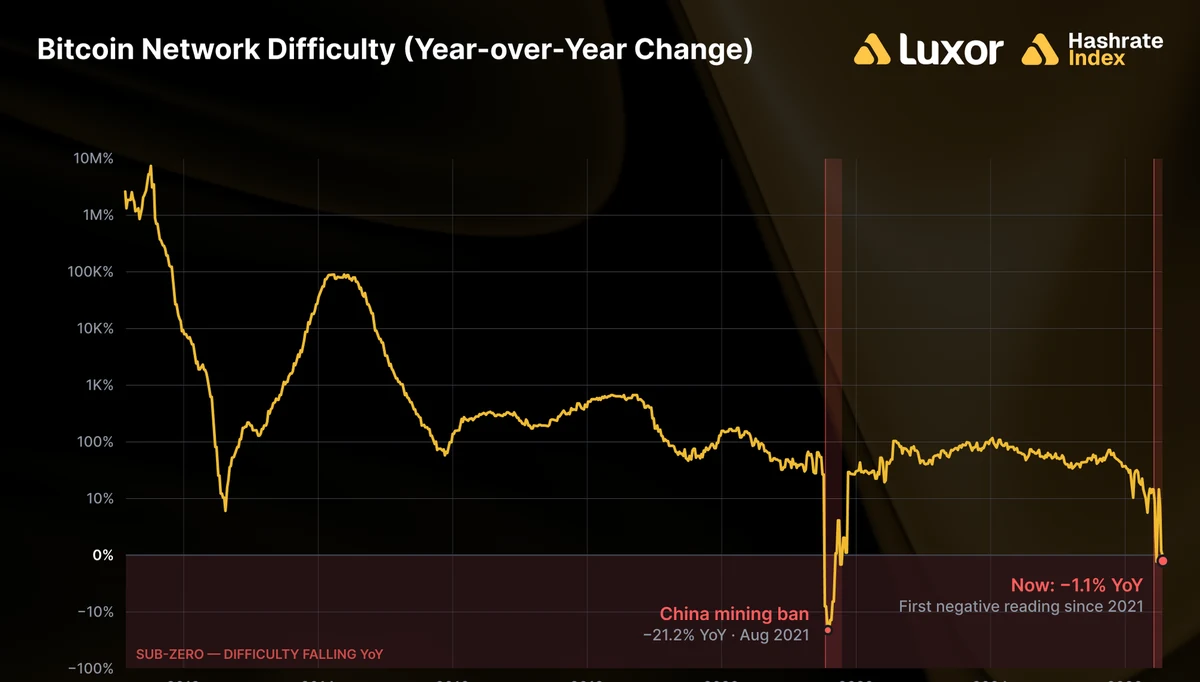
Hashrate Index identifies an unusual annual decline in difficulty and examines pressure from mining economics and equipment shutdowns.
Analysis and practical implications
This section is our analysis and illustrative calculations, separate from the source report.
An annual comparison is different from an adjustment
A difficulty adjustment describes one change in the network's operating target. A year-over-year comparison asks whether the current level is above or below a much earlier observation. These views can move differently: a recent increase can occur while the annual comparison remains negative, or a recent decline can occur within a longer upward trend.
For a mining operator, the annual observation is useful context rather than a direct instruction to buy or switch off equipment. The operating decision still depends on current receipts, electricity cost and the performance of the actual fleet. A historical rarity does not make the next direction predictable.
Difficulty alone does not determine dollar revenue
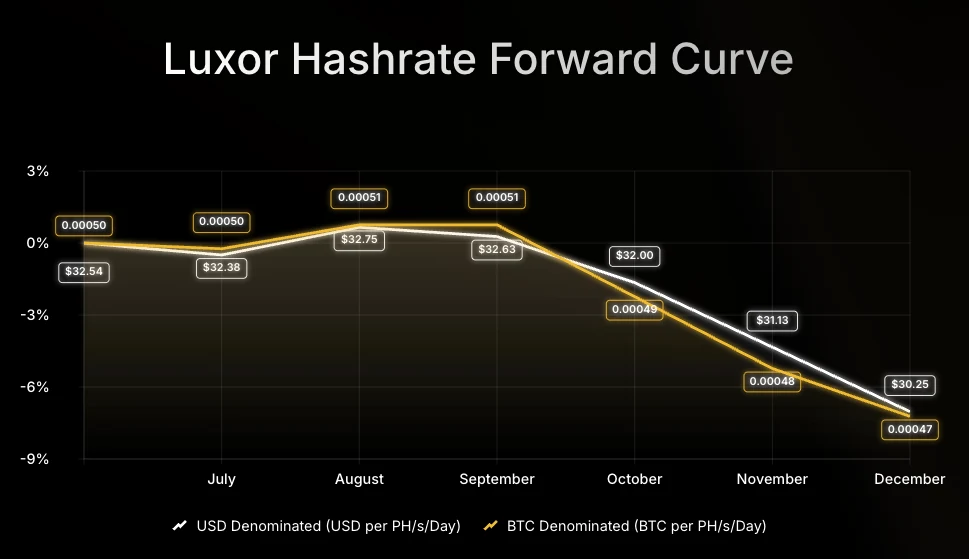
Mining economics also depend on the value of the reward and the work delivered by the miner. A lower difficulty can improve the amount of network reward associated with a given quantity of work, but a change in the coin's exchange value may offset or amplify the dollar result.
Keep those effects separate in a review. Examine coin-denominated receipts alongside the currency used to pay operating expenses. This prevents an exchange-rate movement from being mistaken for a difficulty effect and makes it easier to explain why the electricity margin changed.
Compare equipment by its contribution at the site
When conditions weaken, operators may review the least efficient or least reliable machines first. That does not mean every older model is automatically uneconomic. A lower purchase cost, a favorable power arrangement or a specific operational role can change the comparison.
Calculate the contribution of each group using measured output and consumption. Include downtime and repair burden. A nominally efficient device that frequently fails can contribute less than a stable device with a weaker factory specification. The relevant question is how each group performs within the site's actual constraints.
Use the unusual period to improve records
Periods of changing difficulty are a good reason to maintain consistent operating data. Record fleet composition, firmware settings, accepted work, electrical consumption and extraordinary maintenance. That information allows the operator to distinguish network conditions from changes inside the installation.
For planning, use several market scenarios rather than extrapolating one annual comparison. The observation can justify reviewing assumptions, but it cannot establish a guaranteed turning point. A stronger operating plan remains understandable if difficulty or the coin price moves in the opposite direction from the expectation.
Source: Hashrate Index / Luxor ↗
Mining calculator ↗