Miner Control 1.7.1 shows rejected work for home AxeOS miners
Source report: 2026-11-11 · Editorial analysis published: 2026-11-13
The dashboard adds work and rejection indicators for a local ckpool. It follows a same-day release that lets operators export a diagnostic report.
A new view of the work reaching the pool
Miner Control 1.7.1, published on November 11, adds Pool Work and Rejected indicators to the dashboard’s POOL page. The project is a monitor for home miners running AxeOS, including models in the Bitaxe and NerdQaxe families. The new indicators concern an operator’s own ckpool, software that distributes jobs and accepts shares from miners. They show what reached that service, an extra check alongside the speed reported by the machine.
A share is a small proof that a miner did a portion of the work. The developer says Pool Work adds up accepted shares by their difficulty, a measure of how hard each proof was to find. The rejected-work percentage also weights work instead of simply counting entries. That matters because one harder share can represent more work than several easier ones. The tile turns yellow at 2%, the project’s display setting. Two percent is a cue to look closer, not a universal line between a healthy and broken miner.
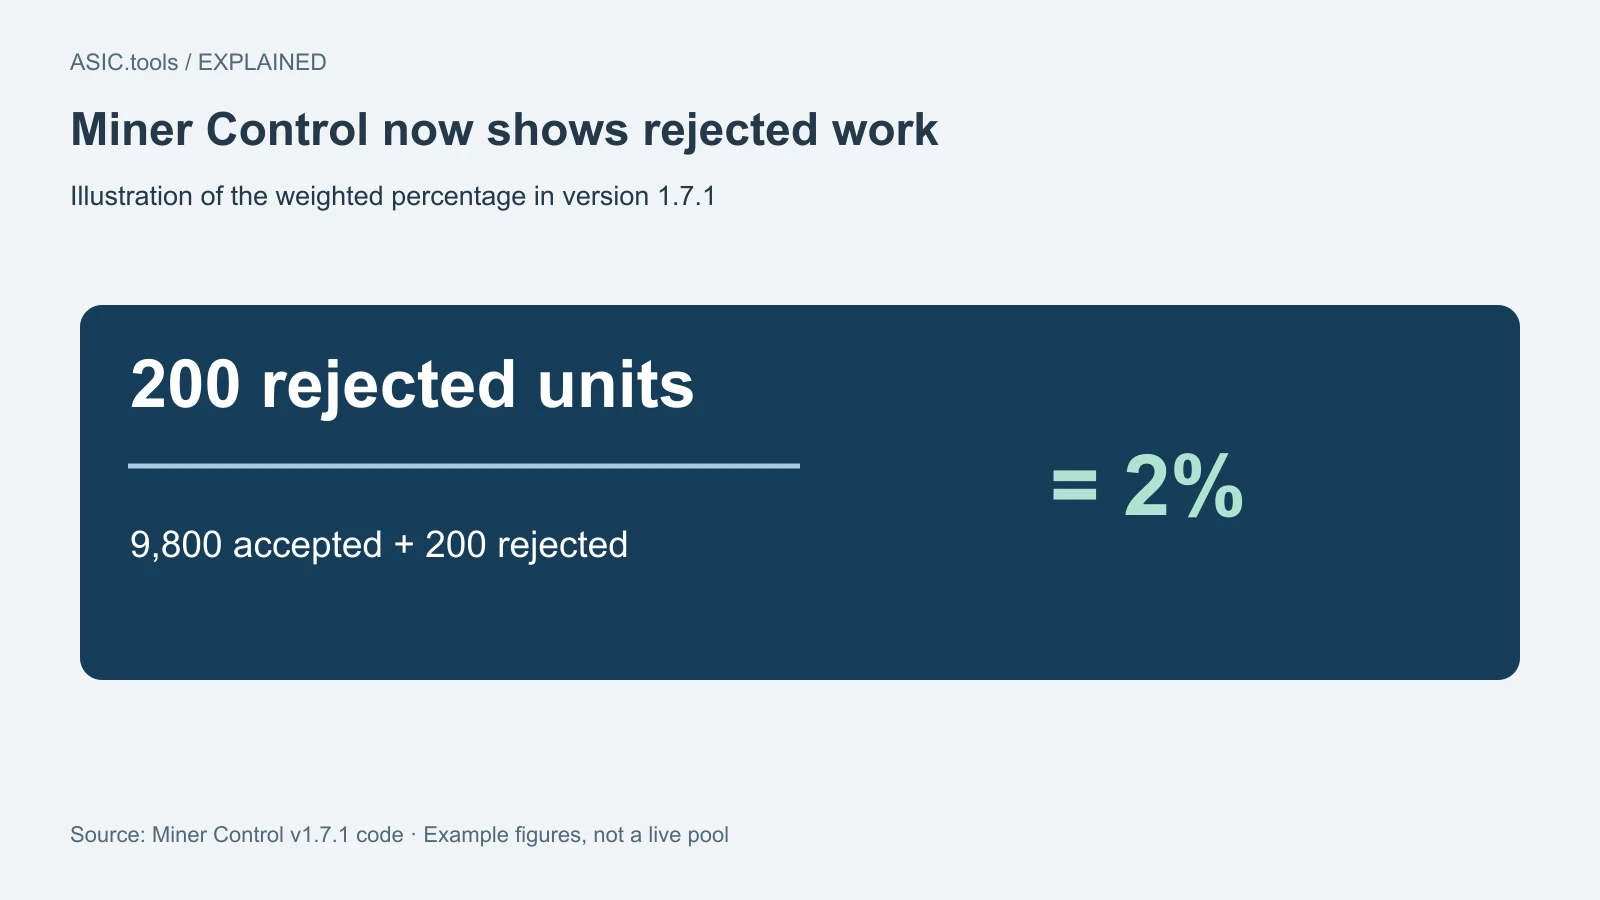
The tagged source code makes the arithmetic explicit: the panel divides rejected work by accepted plus rejected work. As an illustration, 200 units rejected and 9,800 accepted make a 2% rejection rate. The units are weighted work, not the number of times the screen logged a rejection. If no work is reported, the percentage alone cannot show whether a miner is active.
What the panel can tell you
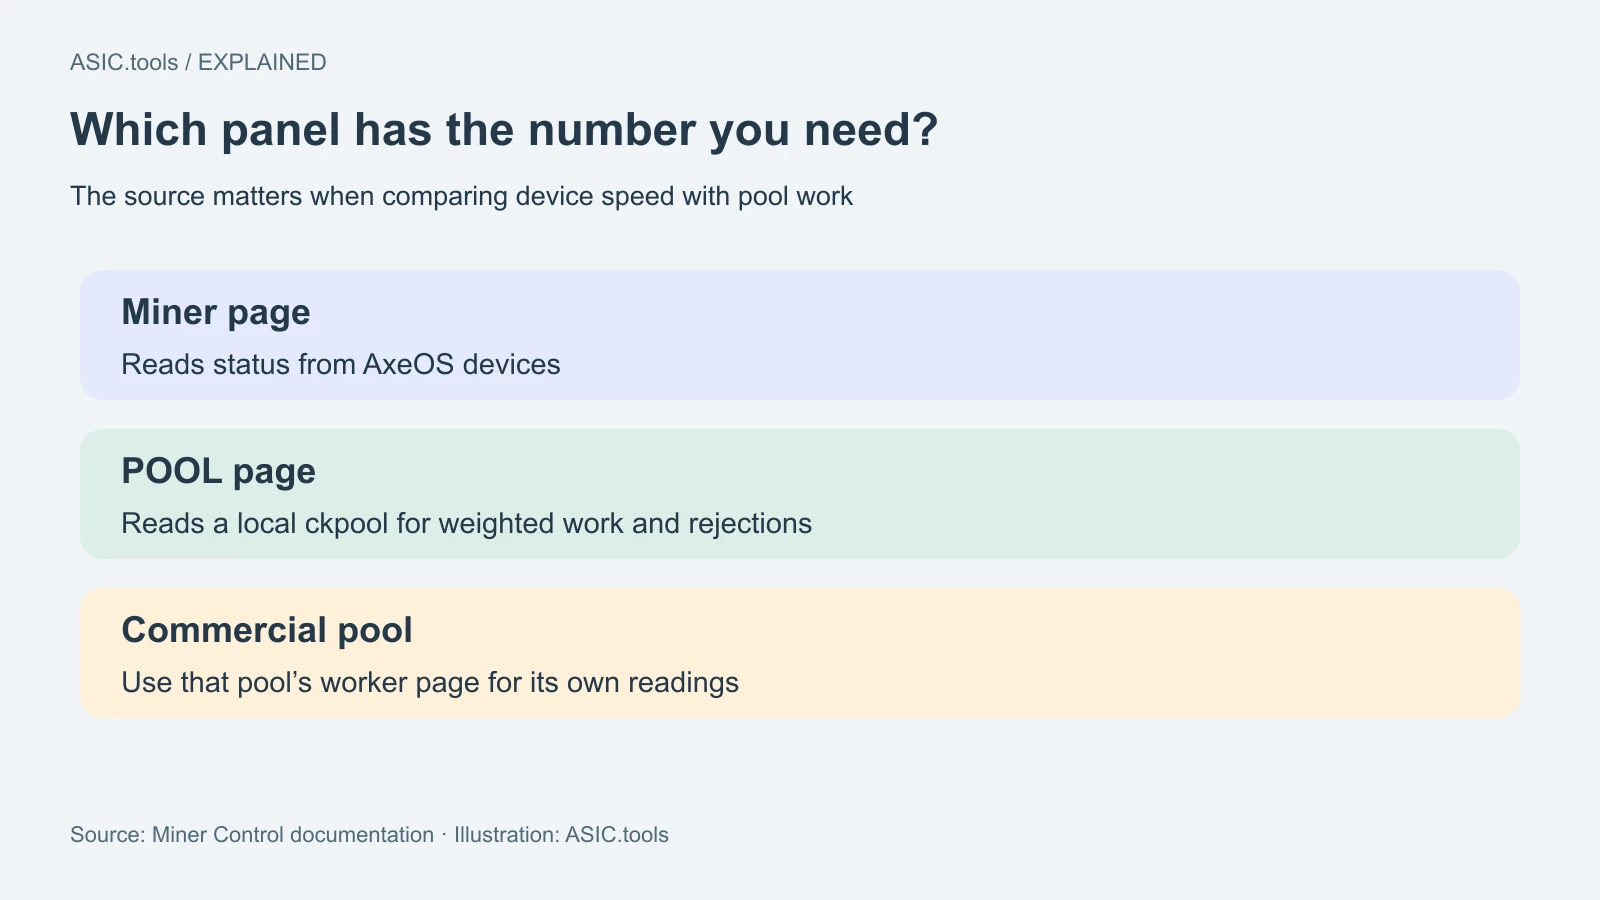
The dashboard’s miner page reads device data and can be used when devices point to other pools. The dedicated POOL page reads a local ckpool installation; the project says it does not read equivalent records from other pool software there. If you have a Bitaxe on a commercial pool, use its own worker page for that pool’s numbers. Two dashboards can differ when they count over different time windows or measure different points in the same path.
Look for patterns across time before changing settings. After a brief network interruption, a miner can report its usual speed yet some of the work it submits may arrive too late. A sustained gap deserves a check of the device log, connection and pool replies. Start with when the change began and whether it affects one machine or all of them. The percentage shows that work was rejected; the log and pool replies help explain why.
Also note the denominator. One rejection can look large just after a restart, when little work has been counted, and small once much more work has reached the pool. A single percentage also cannot reveal whether one worker is responsible for most of the losses. Compare device records over the same period before changing settings across the whole setup.
Send a report you can read first
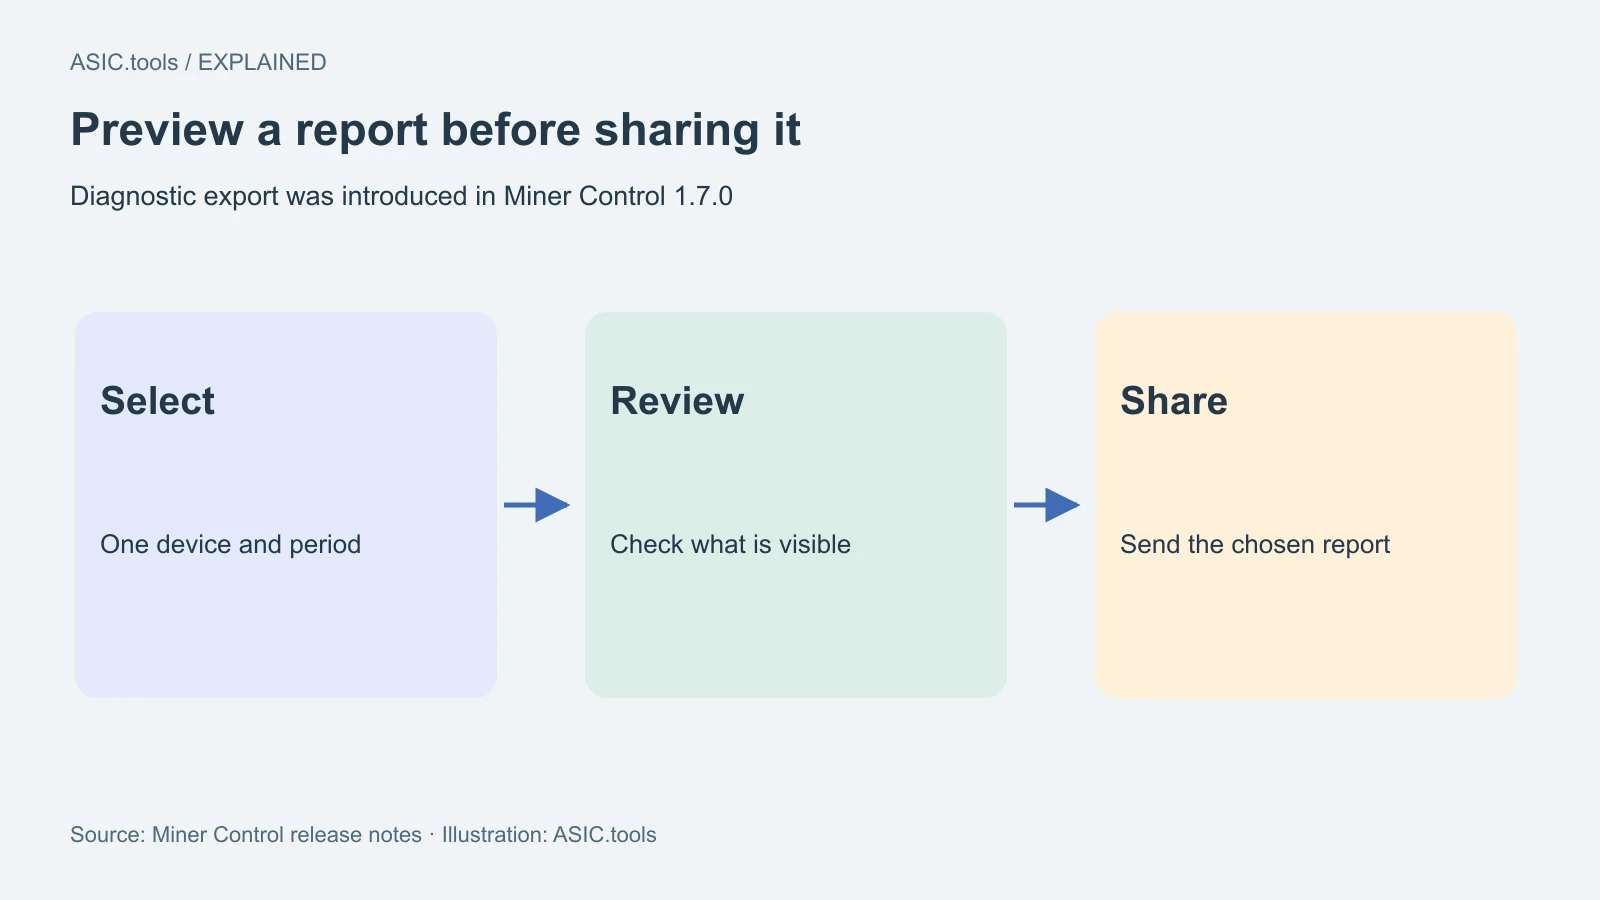
Version 1.7.0, released earlier the same day, introduced a diagnostic export from the LOG page for a selected miner and time range. It creates an English text report that can include firmware, board revision, outages and restarts. The project says wallet addresses are removed automatically, and the preview can remove IP and pool addresses as well. Read that preview before sharing it. Use the shortest period that still contains the fault, especially when asking for help in a public forum.
A practical use is to compare the time the machine restarted with the time it began hashing again and when a pool first accepted work. Those events describe different stages. The selected period can show whether one restart is the issue or the same pattern keeps returning. Write down any settings change and make one change at a time so that the next set of readings has a clear explanation.
A report is also easier to use if the reader knows what you expected. Add one sentence saying which indicator changed and when you noticed it. If you are asking about rejected work, include the matching period from the pool dashboard rather than relying on a report made at a different time. The release notes describe an English export, so add a short note in the language your support contact uses if that helps.
Keep the dashboard private
The project says the dashboard reads device status and does not change miner settings. Its settings page has no password. Keep it inside your local network or a private VPN, and avoid forwarding its port to the public internet. The dashboard is a way to see where work and time are lost. Check the corresponding device or pool records before using it to diagnose a fault or to judge earnings.
Finally, keep a copy of the report you actually shared, rather than relying on a live dashboard that changes. A later reading can show whether the symptom returned. Keep the original log private and recheck any new export before sending it, since the selected machine, time and visible settings may have changed.
Source: Miner Control ↗ · Miner Control 1.7.0 — diagnostic export ↗ · Miner Control — documentation and security notes ↗
Mining calculator ↗