EIA sees higher U.S. home power prices in 2027. What it means for a miner
Source report: 2026-11-10 · Editorial analysis published: 2026-11-12
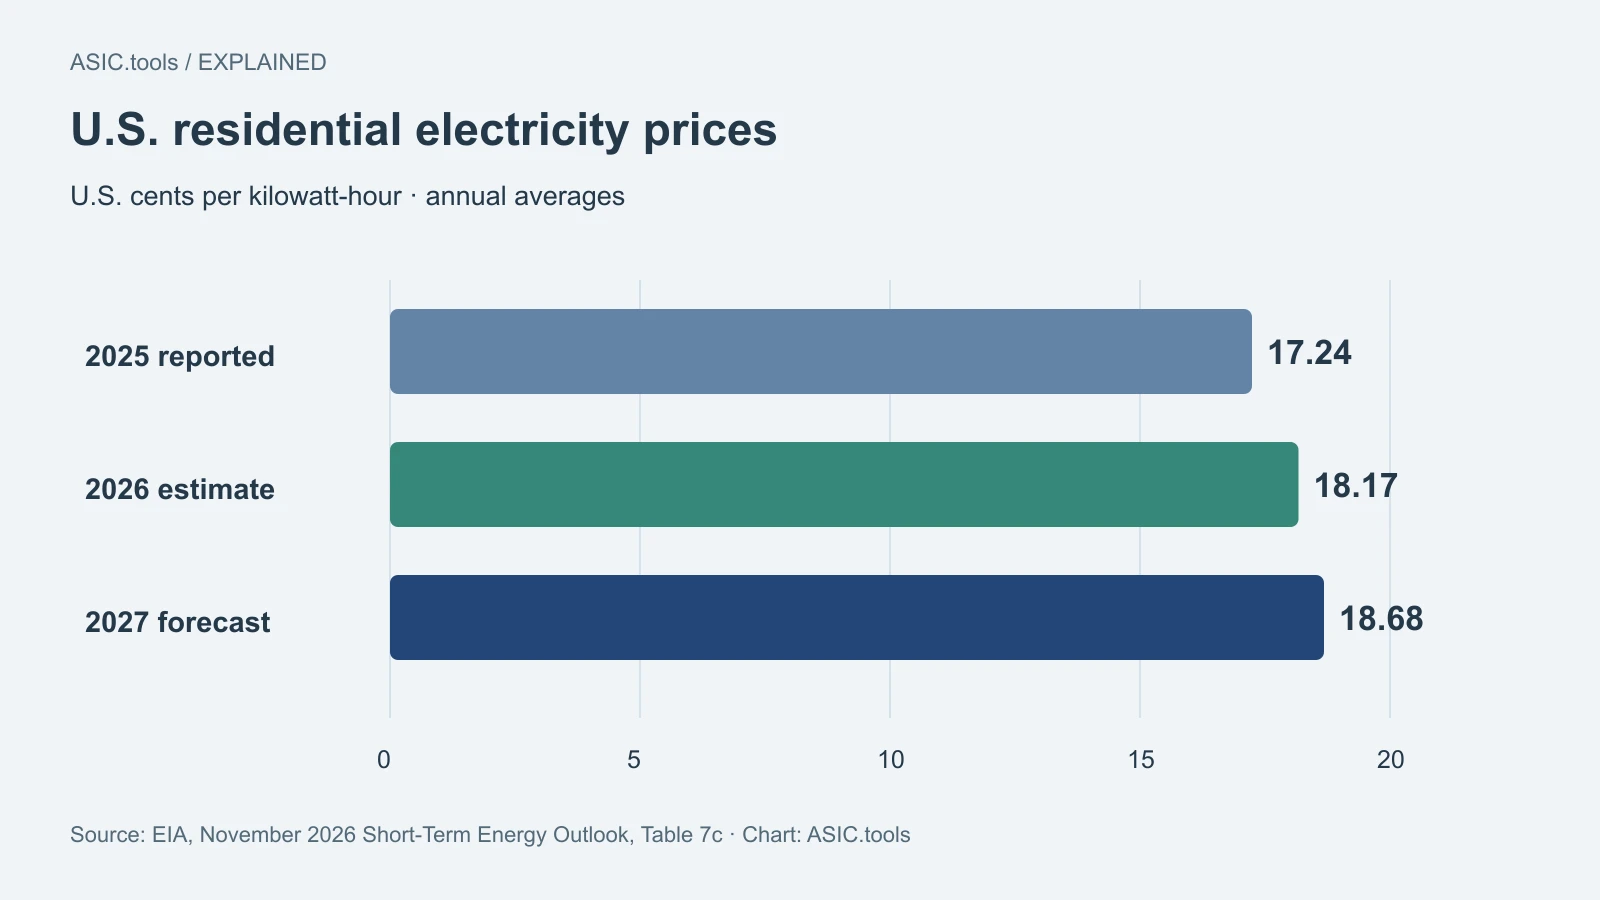
The November outlook puts the U.S. residential average at 18.17 cents per kWh in 2026 and 18.68 in 2027. Your utility tariff matters more than either figure.
What the November outlook says
On November 10, the U.S. Energy Information Administration (EIA) estimated that households would pay an average of 18.17 cents per kilowatt-hour in 2026, up from 17.24 cents in 2025. It forecast 18.68 cents in 2027, about 2.8% above the 2026 estimate. For a home miner, that is a reason to revisit the running budget for a machine that may be on all day.
The October outlook had put 2026 at 18.21 cents and 2027 at the same 18.68 cents. So the latest report trims the current-year estimate by 0.04 cent and leaves the next year's figure in place. The distinction matters: a higher price compared with this year is different from a fresh increase in the 2027 forecast.
Your utility sets the bill
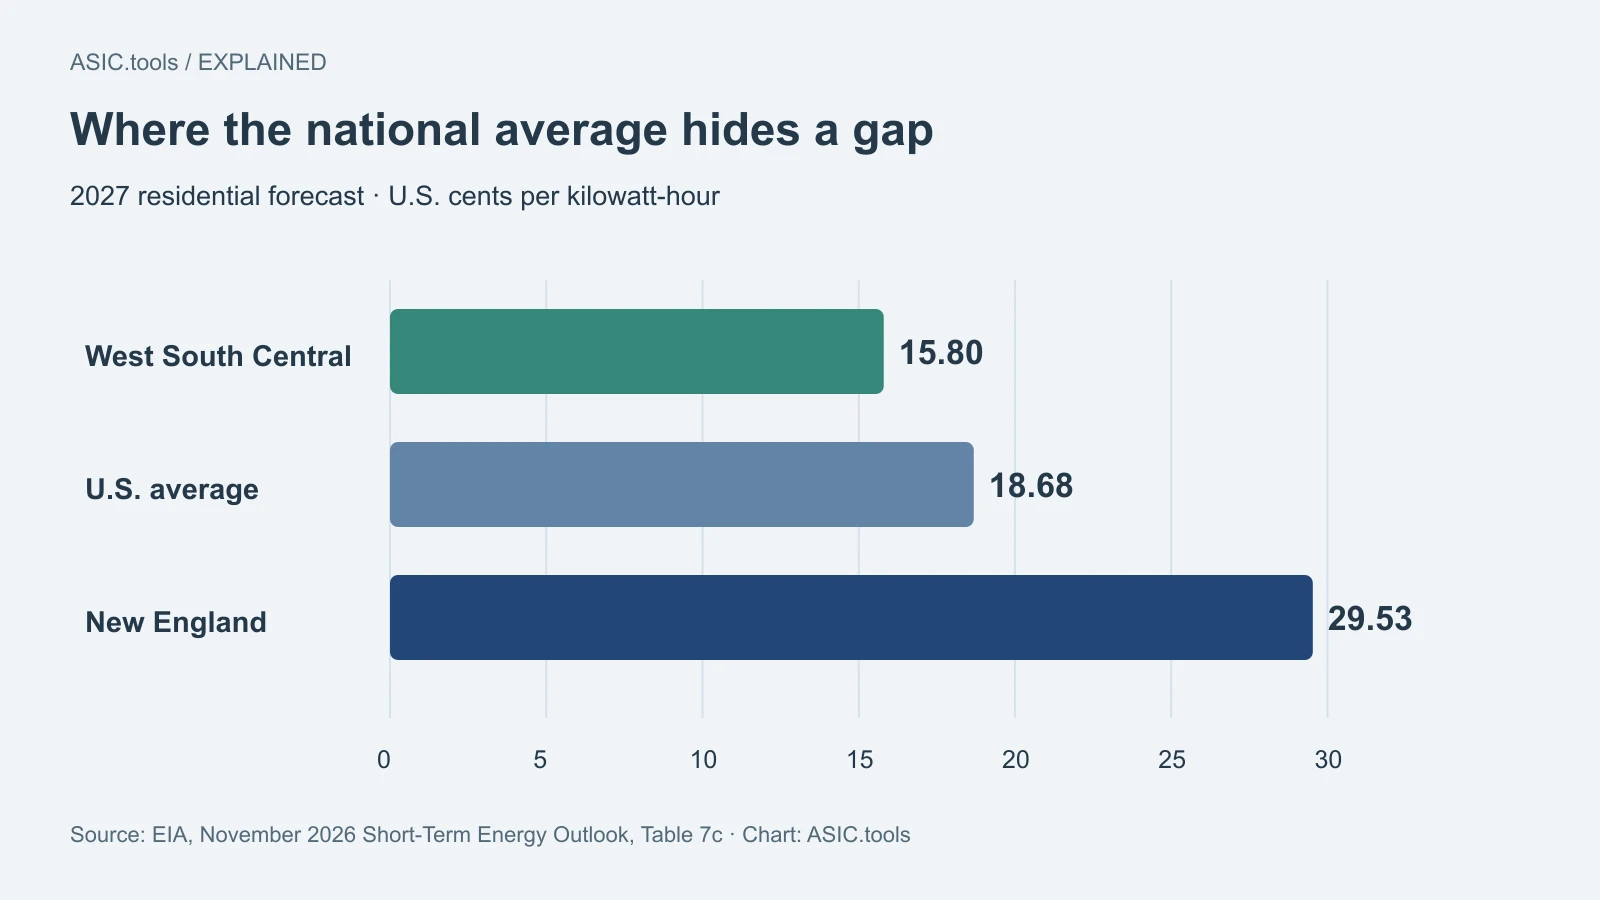
The numbers are national averages for residential customers. The November report projects 29.53 cents in New England and 15.80 cents in the West South Central region in 2027. Those estimates are for regions, too. Customers in the same region may pay different rates under different utilities and plans.
Wholesale prices tell another story: they describe transactions in power markets. A household buys electricity under the supplier’s retail tariff, which may include delivery and other charges. If your miner runs at home, look at what another kilowatt-hour adds to your bill during the hours it runs. A commercial site or host may have a different contract.
It helps to read the numbers in the same units. In the report, 18.68 is cents per kWh, or $0.1868 per kWh. If your calculator asks for dollars and you enter 18.68, the result will be a hundred times too high.
A year at one kilowatt
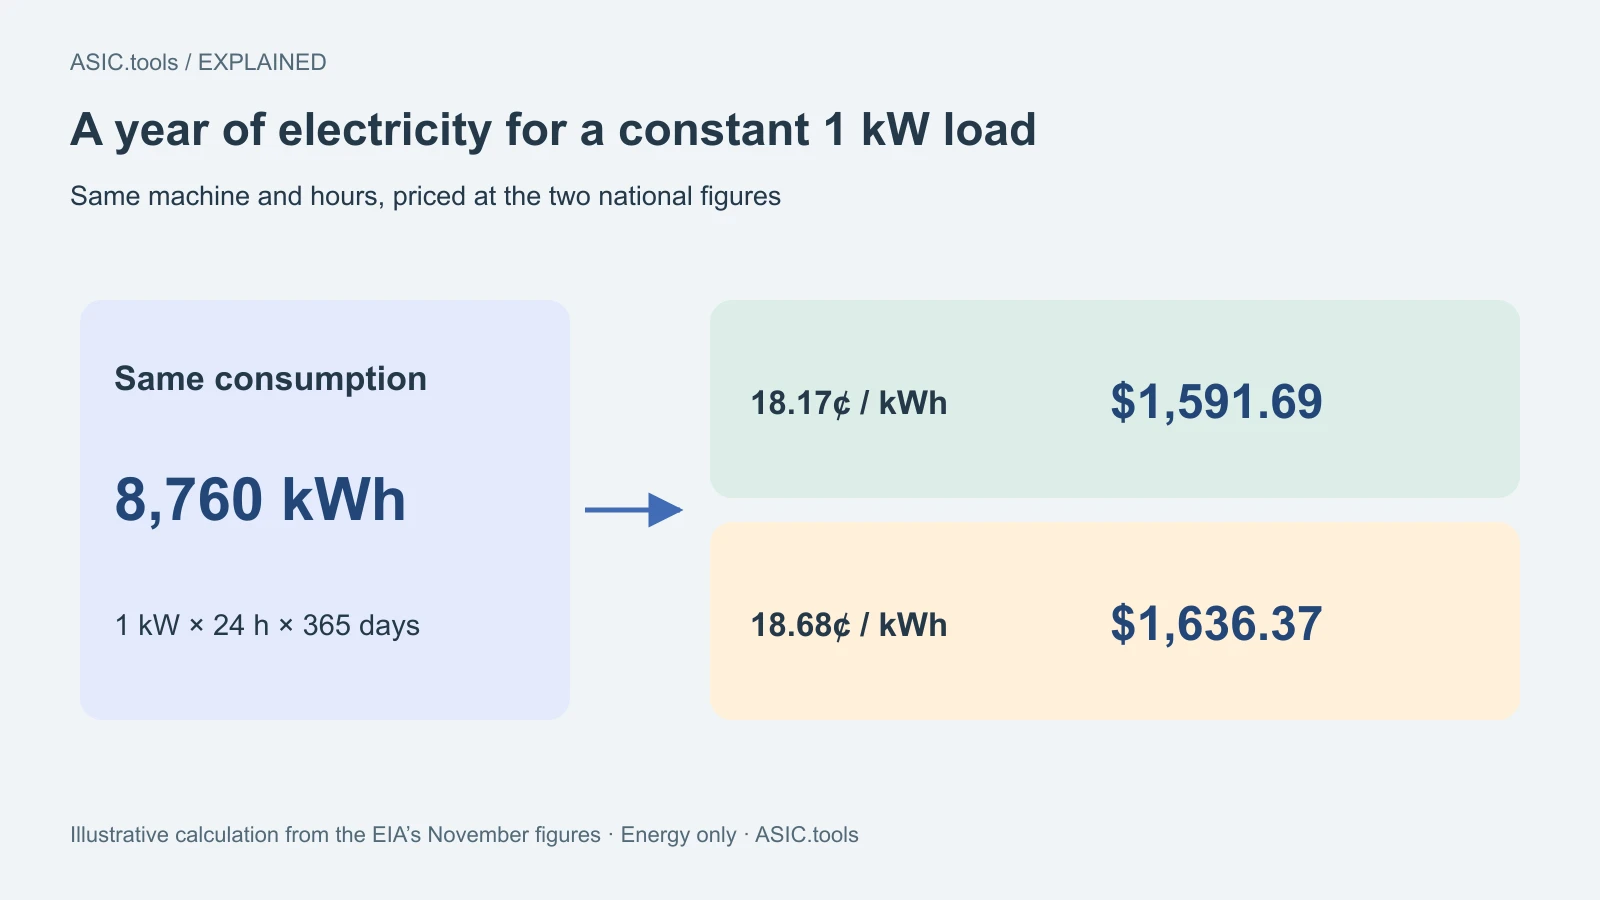
A machine drawing a steady 1 kW at the outlet uses 24 kWh a day. Over a 365-day year with no downtime, that is 8,760 kWh. At 18.17 cents, this would cost about $1,592 for the year. At 18.68 cents, the same work schedule would use the same amount of power and cost about $1,636, an increase of about $45 before rounding the individual totals.
That example is just the energy cost at two assumed prices. It excludes separate ventilation and fixed charges, as well as the price of the miner, pool fees and downtime. To adapt it, measure the draw of the setup you actually run. The power listed on the box may be measured under conditions that differ from yours.
Read the rate before changing the schedule
Start with your latest bill and the tariff for your address. If the price changes by hour, match each rate to the hours you plan to mine. If the price rises after a usage threshold, check which band the additional load would reach. Fixed charges that you already pay are different from charges that increase when you use more electricity.
If the bill gives just one total, use it as a starting clue and read the line items. Dividing the total by usage includes any fixed monthly charge. For a device you would add to an existing account, that charge may already be paid whether the miner runs or not.
Then check the other side of the calculation. A short payout snapshot may reflect price moves, changes in mining difficulty or the pool’s payment timing. Compare income and energy use over the same period. If a time-of-use plan offers a cheaper overnight window, compare how much you would save with the income lost during the hours you skip.
Use the forecast to test your budget
You can put the supplier’s rate into a mining calculator and try a second run with a higher rate. If a small increase makes the machine unprofitable, check whether you can run it less, change a supported power mode, or wait on the purchase. That makes the forecast useful without treating the national average as a rate quote.
For a purchase decision, try several combinations of power price and mining income. Write down the assumptions in each row. If the result holds up only at the cheapest rate and strongest income, you know which estimates to verify before committing.
The update is one planning input. The figures in the outlook describe the U.S. residential market; what you pay in 2027 will depend on the tariff at your address and when you turn the machine on.
Source: U.S. Energy Information Administration ↗ · EIA — October 2026 Short-Term Energy Outlook ↗
Mining calculator ↗