Bitcoin rebounds above 80,000 after Saturday’s dip: the miner’s electricity bill stays put
Source checked: 2026-10-25 · Editorial analysis published: 2026-10-25
October 24 exchange candles confirm a dip below 80,000 and a higher close. Binance BTC/USDT and Coinbase BTC/USD show different prices; the October 25 snapshot is not a profit forecast.
Saturday’s fall and rebound are visible in exchange data
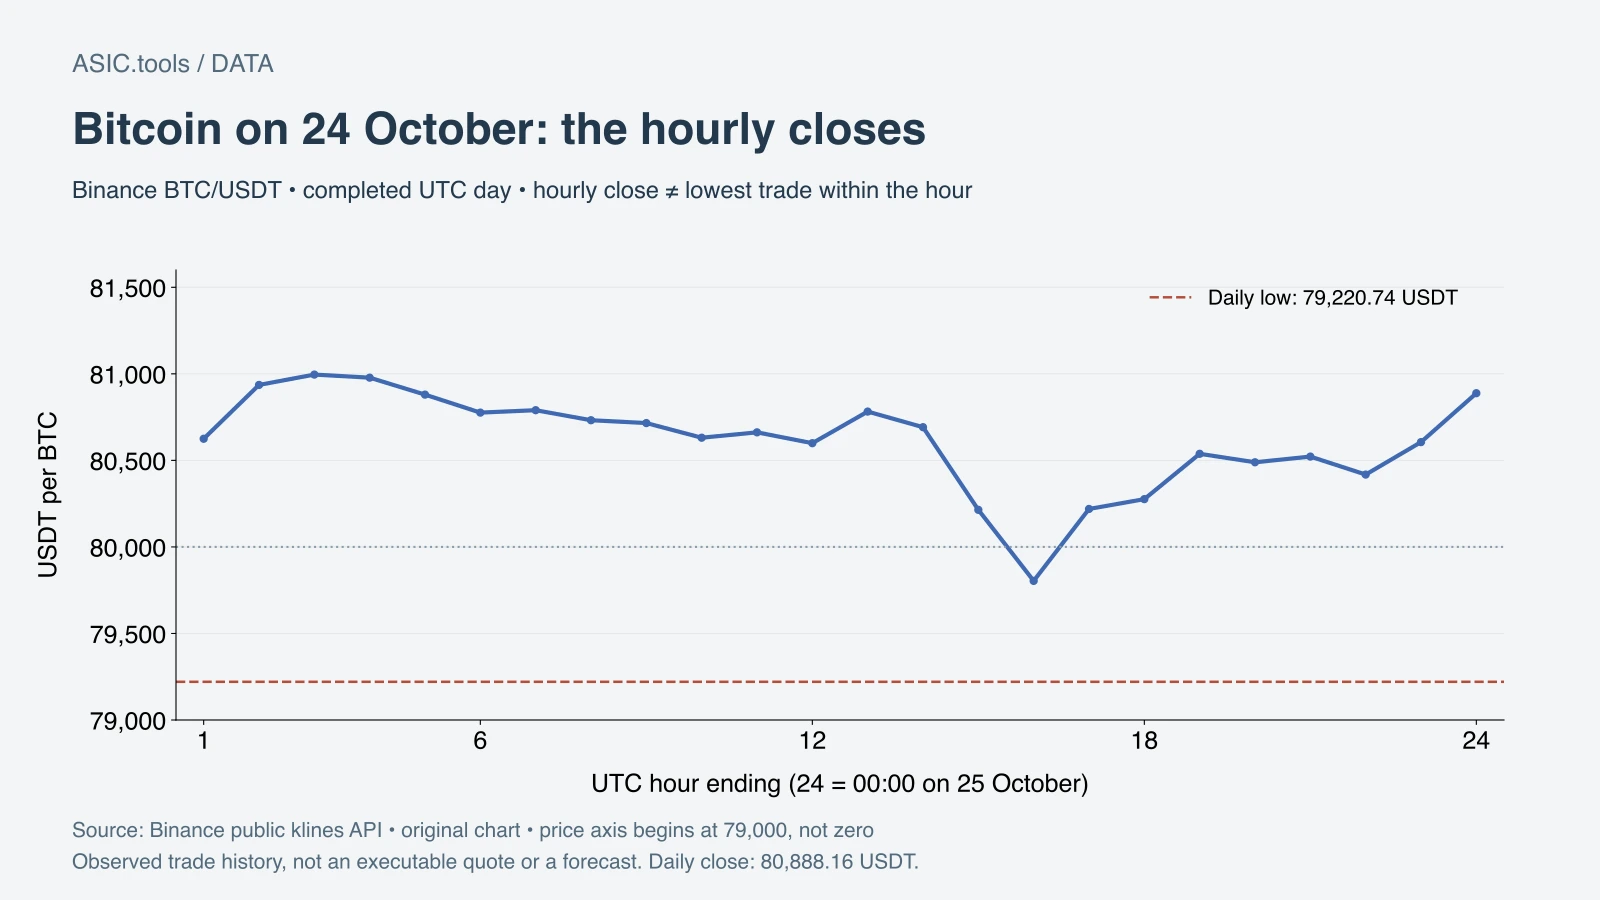
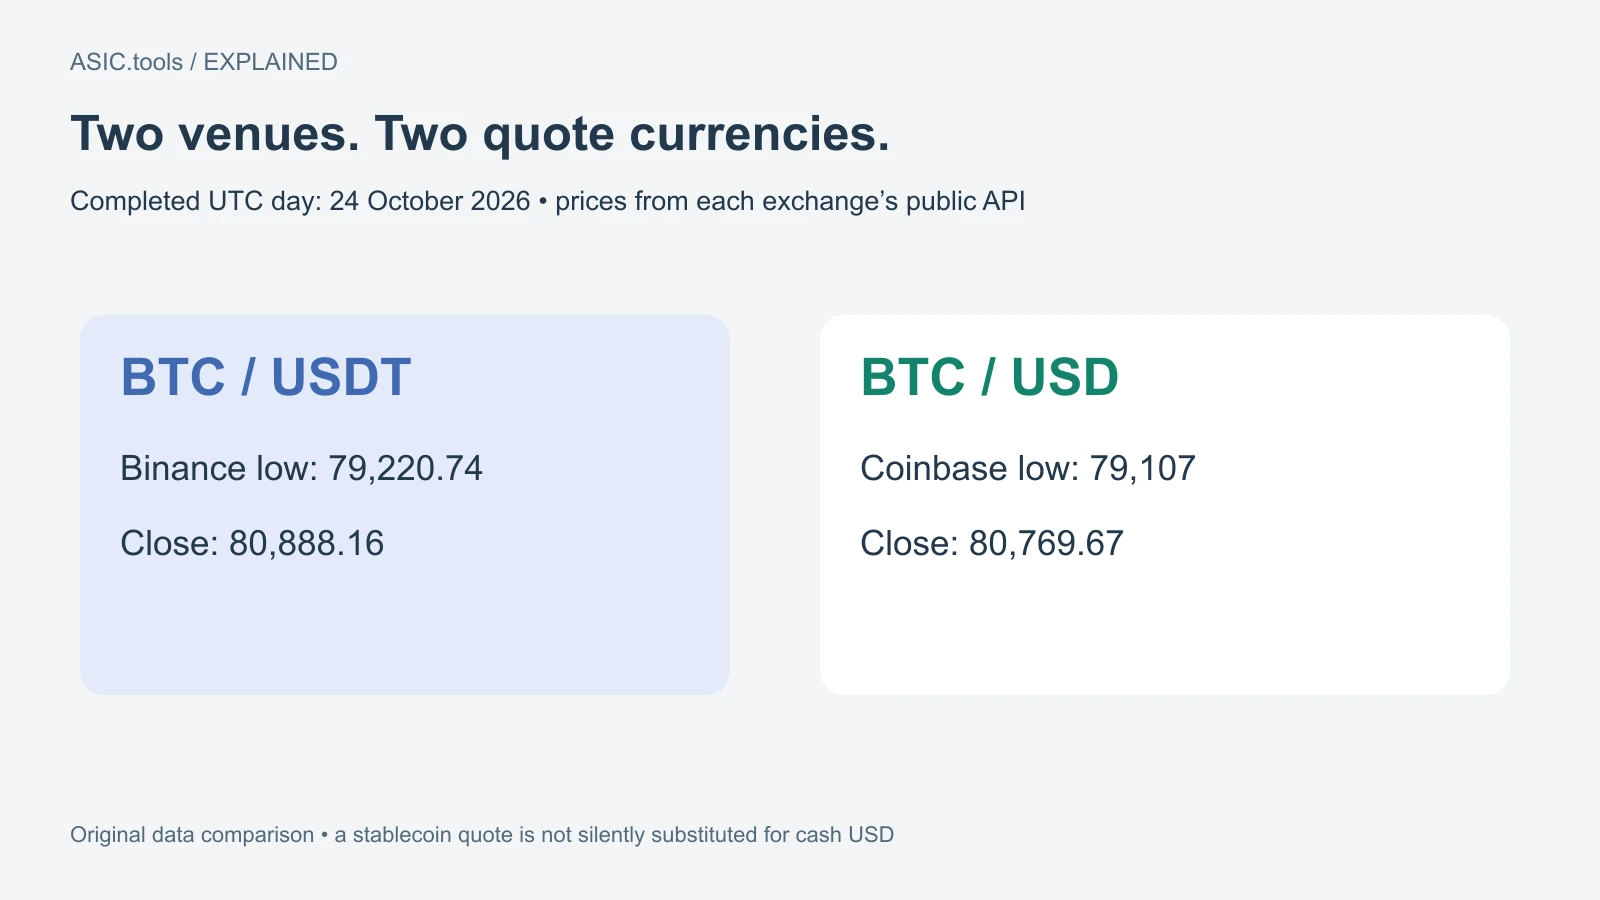
Bitcoin traded below 80,000 during October 24 and finished the UTC day above that level. On Binance’s BTC/USDT market, the daily low was 79,220.74 USDT and the close was 80,888.16 USDT. The opening price was 81,189.44 USDT, so the recovery from the low still left the day about 0.37% down from its open.
Coinbase’s separate BTC/USD market recorded a low of $79,107 and a close of $80,769.67 for the same UTC day. These are two venues and two quote currencies. They confirm the broad move without establishing one exact price available to every Bitcoin holder.
At 13:59:17 UTC on October 25, Binance’s captured 24-hour ticker showed 80,386.43 USDT. That is a dated market snapshot, not Sunday’s final closing price. The completed October 24 candle and the still-changing October 25 reading answer different questions.
Why the market pair matters
BTC/USDT quotes one Bitcoin in Tether units; BTC/USD quotes it in US dollars. USDT is a stablecoin designed to track the dollar, but naming it is more accurate than silently calling every quoted unit a cash dollar. Exchange trading conditions can also differ.
A daily candle summarizes the opening, highest, lowest and closing trade prices over its period. Here that period runs from midnight to midnight UTC. A daily low says a trade reached that level on that venue; it does not mean everybody could sell their entire balance at that price.
This is why reports can give slightly different lows without necessarily contradicting one another. Match the venue, trading pair and time window before comparing numbers. The chart in this report uses Binance’s completed hourly observations rather than joining incompatible prices into a single invented market line.
Each point on the hourly line is an hourly closing price. The lowest trade within an hour may lie below that line; the daily minimum is therefore identified separately. The graphic is a summary of the recorded market, not a claim to show every trade or a future path. Keeping the distinction makes a simple chart more informative without making its visual precision misleading.
The coins earned and their sale value are different measures
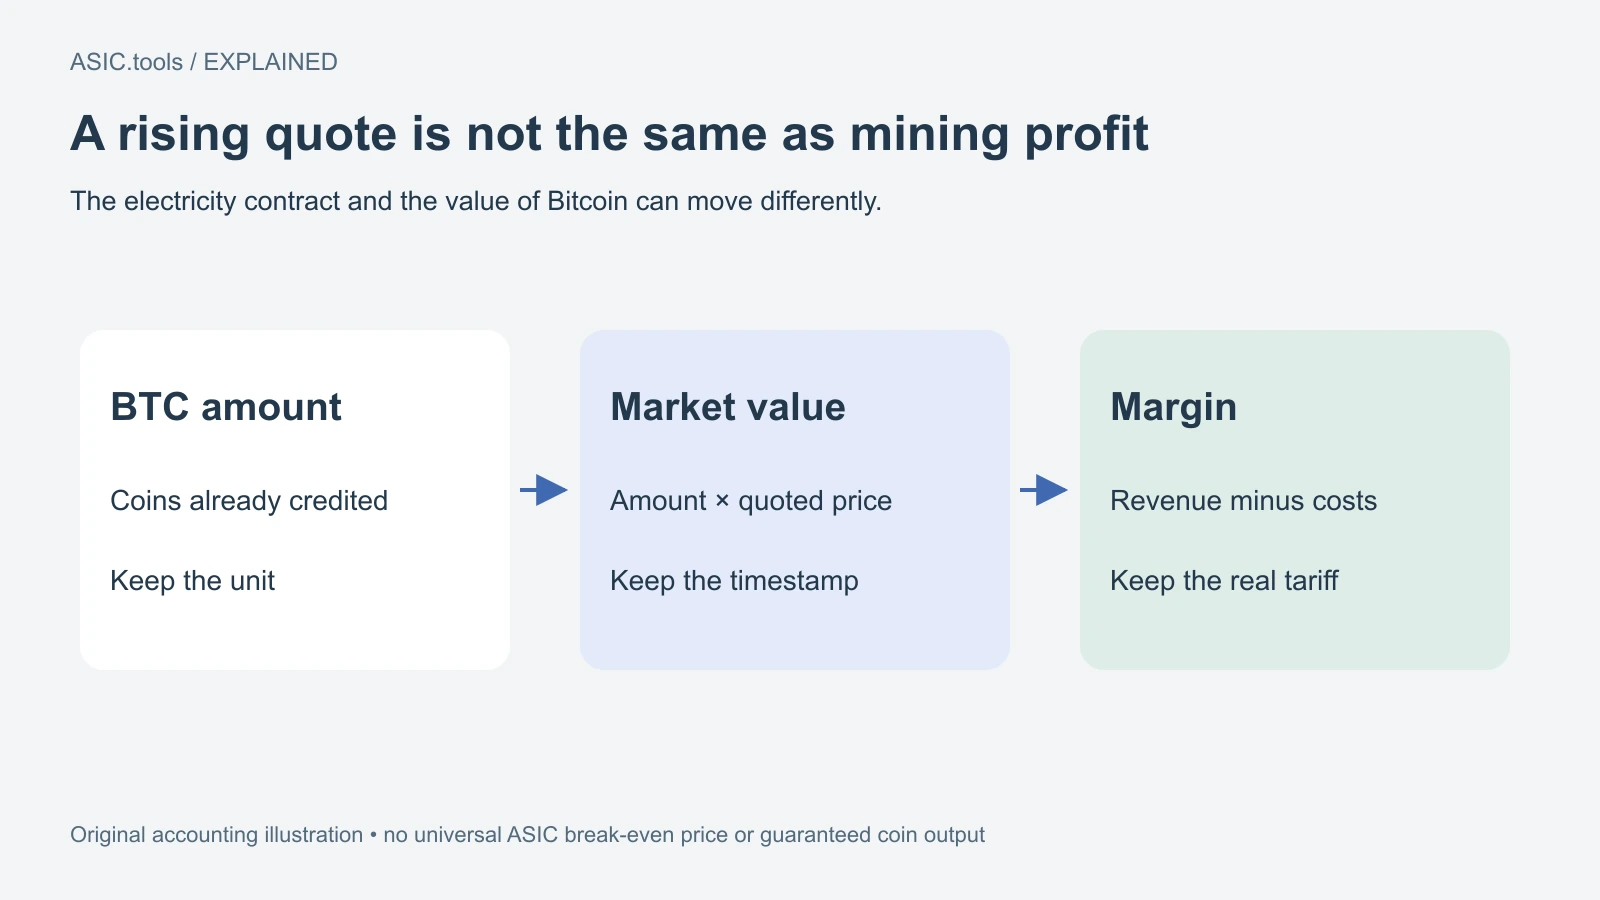
For someone paid in Bitcoin, a price move changes the money value of the coins held. It does not directly change the number already credited by a pool. A balance measured in BTC and the cash obtainable by selling it are connected, but they are not the same accounting entry.
For illustration, 0.001 BTC would be quoted at 79.22074 USDT at Saturday’s Binance low and 80.88816 USDT at the close, before trading costs. The example only converts a fixed amount of Bitcoin using those observed prices. It does not claim that a particular miner produces 0.001 BTC a day.
Future mining output also depends on network competition, reward rules, pool terms and actual machine operation. The price chart alone cannot establish how many coins a machine will earn. Nor can a brief rebound prove that a previous level will hold through the coming week.
Electricity does not automatically follow the chart
A running miner consumes power under its electricity contract. Unless that contract has a relevant variable component, the cost of a kilowatt-hour does not fall merely because Bitcoin has a bad trading session. The electricity bill and the sale value of mining income can therefore move differently.
Profit is what remains after relevant costs, not the gross value displayed next to a coin balance. Electricity, pool charges, hardware and other expenses depend on the setup. A round Bitcoin price such as 80,000 is not a universal break-even point for every ASIC.
A useful operating check keeps measured wall power, actual tariff and current revenue assumptions in separate fields. Wall power means the whole device’s draw from the socket. Updating a market price should not accidentally overwrite the electricity rate or turn an estimate into a guaranteed payout.
What to take from the weekend move
The confirmed event is the drop and rebound recorded by the exchanges, followed by a dated Sunday reading above 80,000 USDT on Binance. The numbers do not by themselves identify one cause, establish the effect of ETF flows or validate a commentator’s next price target.
If selling coins to meet a bill, check the current executable quote, trading fees and withdrawal conditions at the service you actually use. A chart is a record of trades, not a reservation of a sale price. Money in a trading account may also have a different withdrawal path from coins held in a personal wallet.
For miners, the weekend is a reminder to compare income and costs using compatible units and dates. Preserve the BTC amount, state the quote currency and timestamp, and calculate the margin with the actual electricity contract. That gives the observed price move a practical meaning without turning it into a forecast.
Source: Binance / Coinbase Exchange ↗ · Coinbase BTC/USD daily candles ↗ · Binance BTC/USDT 24-hour snapshot ↗
Mining calculator ↗